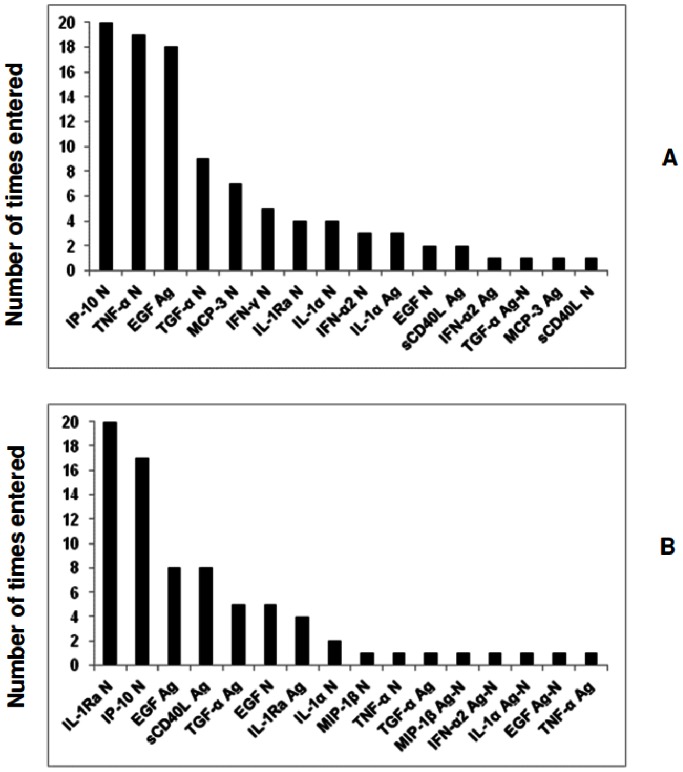
Figure 2. Frequency of analytes in the top 20 GDA models that most accurately classified the Quantiferon positive participants as TB disease (n = 15) or LTBI (n = 39).
Participants were not stratified according to HIV infection status prior to analysis of the data. The columns represent the number of times each analyte was included into the top 20 discriminatory models. A = frequency of analytes in the models generated with raw untrimmed data, B = frequency of analytes in models generated after data was trimmed to scale-down the influence of outliers.

