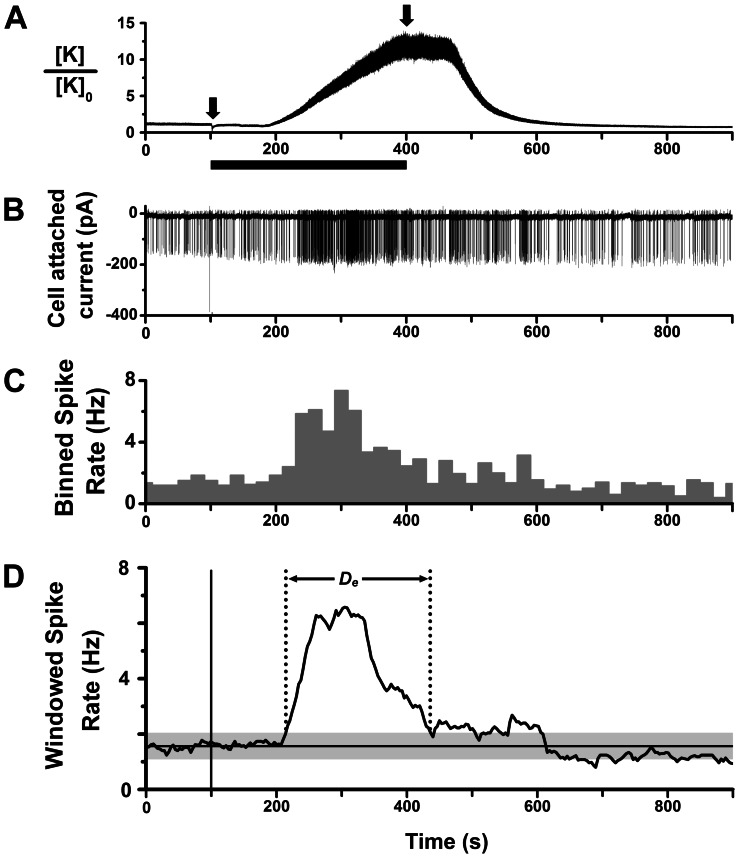
Figure 1. Cell-attached recording of mitral cell spike excitation by CCK-8S.
A. Calibrated timing of agonist application, derived from measurement of K+ junction current of micropipette in olfactory bulb slice. Valve actuation at 100 s (left arrow) switched aCSF flow to high K+ perfusion, and washout was subsequently initiated at 400 s (right arrow). Black bar indicates time period of switched perfusion. Ordinate is the relative change in K+ concentration, estimated from shift in junction current at room temperature, ΔI [pA], as: [K]0 exp(0.004 ΔI), for 100 MΩ pipette. With a flow rate of 5 ml/min, the time lag in junction current shift was ∼80 s. Perfusion for 300 s was minimum time to attain final applied agonist concentration in the bath. B. Excitatory spike response of a mitral cell to bath perfusion of 1 µM CCK-8S, applied with time course shown in A (cell-attached patch recording of action currents, slice from CD-1 mouse). C. Histogram of spike rate over time (counts in 10 s bins) for the response in B. D. Plot of windowed spike rate vs. time, computed from spike times for response in B, with 50 s sliding window. Vertical line marks timing of CCK-8S perfusion switch. Horizontal line marks the mean pre-stimulus spike rate; gray band is 99% confidence limit (3× sdr) around the mean. Calculated duration of excitatory spike response (D e) is indicated.

