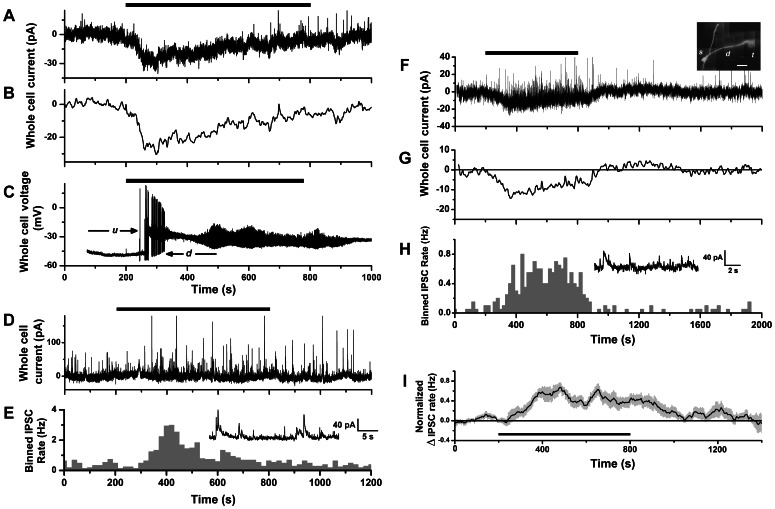
Figure 4. Whole-cell recording of mitral cell currents response to CCK-8S stimulation.
A. Whole-cell voltage-clamp recording of membrane current of a mitral cell during perfusion with 1 µM CCK-8S (horizontal bar), showing slow inward current response. B. Time course of slow inward current revealed by applying a low pass filter (0.10 Hz) to trace in A. C. Whole-cell current-clamp recording from same cell as in A, showing voltage response to reapplication of 1 µM CCK-8S (horizontal bar). Depolarization caused the cell to switch between a lower voltage down-state (d) with action potential firing, and a high voltage up-state (u) with fast membrane potential oscillations, which are known properties of mitral cells [80]–[82]. D. Whole-cell voltage clamp recording from a second mitral cell during perfusion with 1 µM CCK-8S (horizontal bar), showing lack of slow inward current and increase in IPSC activity. E. Histogram of IPSC counts over time (20 s bins) for the trace in F. Inset: expanded segment from D showing IPSCs occurring during CCK stimulation. F. Whole-cell voltage clamp recording from a third mitral cell during perfusion with 1 µM CCK-8S (horizontal bar), showing both a slow inward current and an increase in IPSC activity. Inset: in vitro fluorescence image of cell loaded with Alexa 594 to reveal soma (s), apical dendrite (d) and glomerular tuft (t). Scale bar: 50 µm. G. Time course of slow inward current revealed by applying a low pass filter (0.10 Hz) to trace in F. H. Histogram of IPSC counts over time (20 s bins) for trace in F. Inset: expanded segment from F showing IPSCs occurring during CCK stimulation. I. Mean normalized change in IPSC rate of mitral cell voltage clamp responses to CCK-8S (n = 8 cells, calculated as described in Figs. 2E–F).

