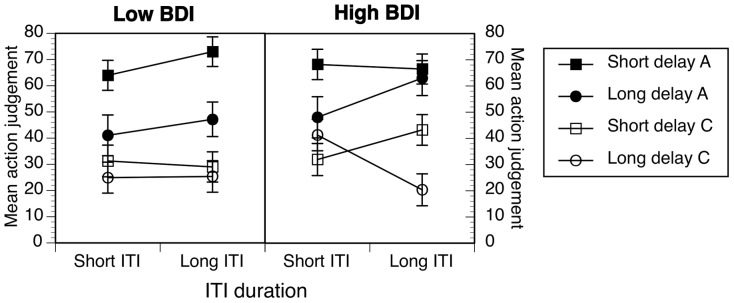
Figure 3. Effects of ITI length and delay duration on ratings of positive (100/50) contingencies.

Data are combined across Experiments 2a and 2b. Error bars correspond to the standard error of the mean. A = action ratings, C = context ratings.

Data are combined across Experiments 2a and 2b. Error bars correspond to the standard error of the mean. A = action ratings, C = context ratings.