Figure 4.
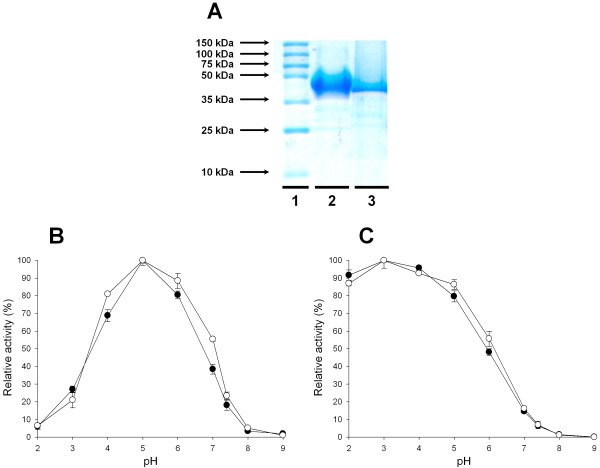
Biochemical characterization of ChU-B mutant. (A) SDS-PAGE: Lane 1, protein standards; lane 2, ChU-B from P. pastoris; lane 3, ChU-B from S. cerevisiae. Samples were resolved on a 12% SDS-polyacrylamide gel and stained with Coomassie Brilliant Blue. (B and C) pH activity profiles. Black circles, ChU-B from P. pastoris; white circles, ChU-B from S. cerevisiae. Activities were measured in 100 mM Britton and Robinson buffer in the pH range from 3.0 to 9.0 with 3 mM DMP (B) or 3 mM ABTS (C) as the reducing substrates. Relative activity (in %) was calculated with respect to the activity at the optimum pH and each point, including the standard deviation, is the average of three independent experiments.

