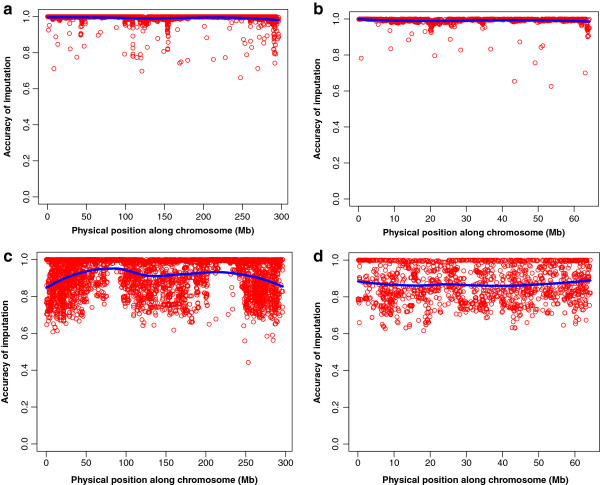
Figure 4.
Accuracy of imputation (IA) across chromosomes 1 and 12 under two genotyping scenarios. Generation F0 and F1 at high density, F2 at low density: chromosome 1 (a), chromosome 12 (b). Generation F0 at high density, F1 and F2 at low density: chromosome 1 (c), chromosome 12 (d). The blue line displays a local regression fit of the data. All results were obtained using the experimental data.

