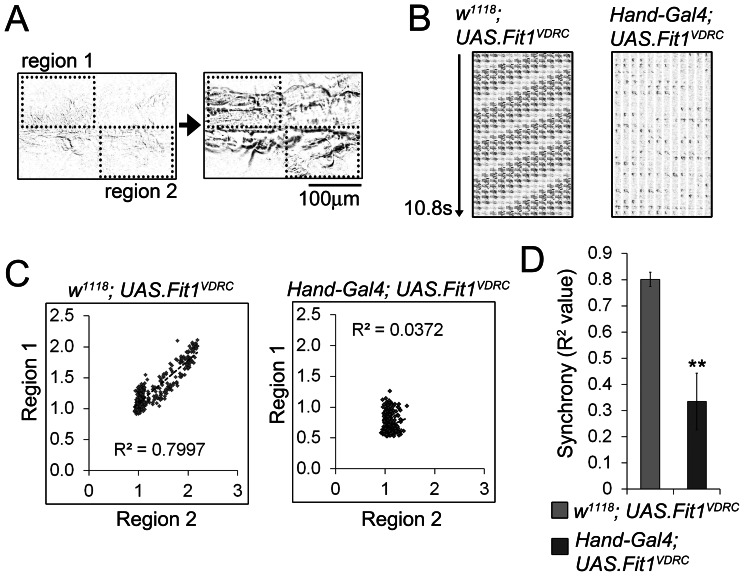
Figure 4. Synchrony between cardiomyocytes is reduced when Fermitin expression is silenced.
Videomicroscopy of the contracting heart from control (w1118, UAS.Fit1VDRC) or Fermitin-silenced flies (Hand-Gal4; UAS.Fit1VDRC) was analysed for movement to ascertain the degree of synchronicity between the different (depicted) regions of the Drosophila heart. (A) Frames from a movement movie of the beating heart where dark pixels indicate movement relative to the previous frame. Pixel intensity in two non-overlapping regions is measured over 10 s and regression analysis performed to quantify the degree of synchrony between the two regions. (B) Concatamerised frames from the movement movie were used to develop cardiac actograms which illustrate the regular, synchronous movement of the heart in a control fly (w1118, UAS.Fit1VDRC), and asynchronous movements in the heart of a Fermitin silenced fly (Hand-Gal4; UAS.Fit1VDRC). The 360 frames run left to right and top to bottom, the entire sequence being 10.8 s long. (C) Representative XY scatter plots of pixel intensity in two regions of a 300 frame, 10 s movement movie, note the lower R2 value for the Fermitin silenced fly. (D) Synchrony (mean R2 values (±SEM)) for control (w1118, UAS.Fit1VDRC) and Fermitin silenced flies (Hand-Gal4; UAS.Fit1VDRC). n = 7 flies for each genotype, **P<0.01.

