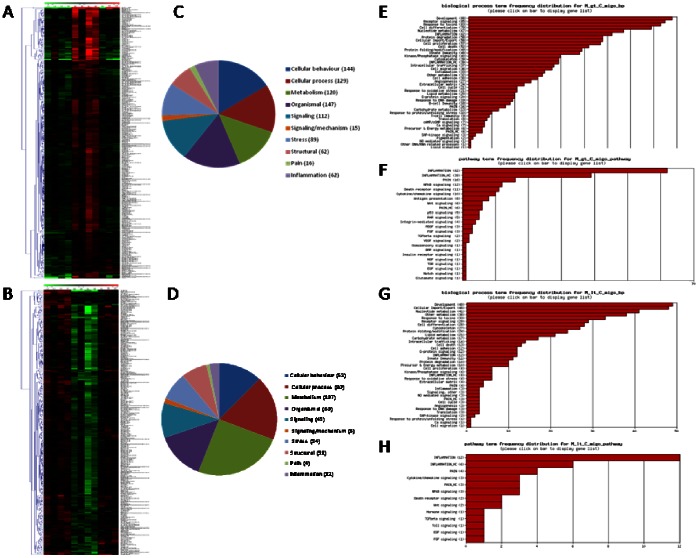
Figure 3. DGA and functional analysis of the effect of NMS on gene expression.
(A–B) Heat maps of the significant genes (p<0.05 and 2-fold up- or downregulation) in NMS rats (Group M, lanes M5–M8) in comparison to VSL#3 treated NMS rats (Group C, lanes C1–C4). In comparison to control rats, NMS modulated the colonic expression of 665 genes (2% of total), 353 were upregulated and 312 downregulated. The expression of the majority of these genes returned to normal value after VSL#3 administration (Group D, lanes D9–D11). (C–D) Pie charts representing biological processes, molecular functions and cellular components among differentially expressed genes (up- or downregulation respectively). (E–G) Frequency distribution of the annotations for upregulated and downregulated genes respectively. (F–H) Frequency distribution of the signaling pathways for upregulated and downregulated genes respectively. gt: greater than; lt: lower than; migo_bp: gene ontology (GO) curated by Miltenyi Bioinformatics biological processs/function; migo_pathways: gene ontology (GO) curated by Miltenyi Bioinformatics pathways; Inflammation_HC: list of genes associated with inflammation from GO data but with more stringent selection criteria; Pain_HC: list of genes associated with pain from GO data but with more stringent selection criteria. Microarray data from 3–4 replicates.

