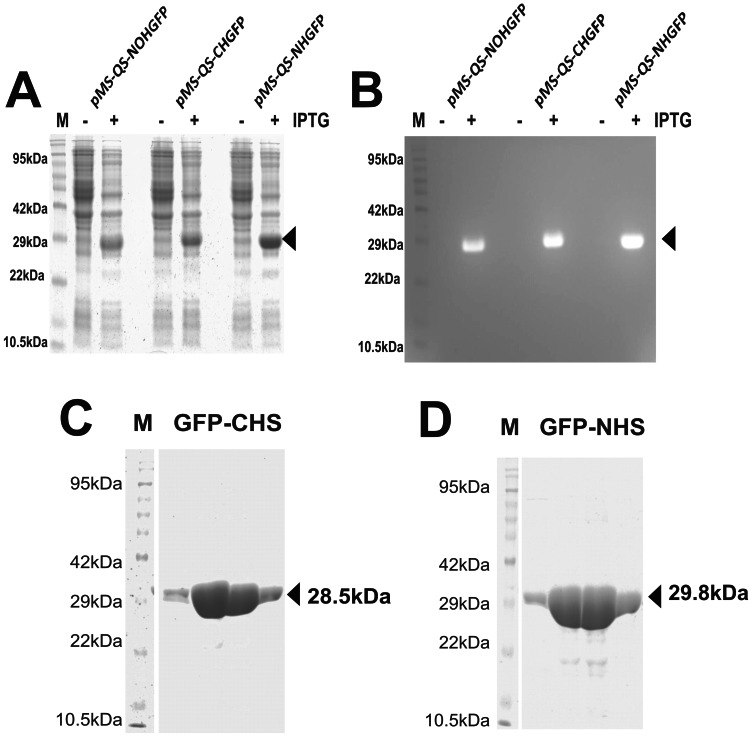
Figure 4. GFP expression from pMS-QS vectors.
(A) GFP induction profile with all the three vectors. Both uninduced (−IPTG) and induced (+IPTG) cultures have been compared. Arrow depicts the induced GFP expression. (B) Zymogram of A that was imaged using 480 nm light and SYBR Gold filter. The arrow represents the folded GFP protein in polyacrylamide gel that fluoresces upon excitation with 480 nm light. Pre-stained protein marker was used in order to make it appear on zymogram. Purification of GFP protein using Ni-NTA matrix was done after overexpressing the protein in the bacterial cells having pMS-QS-CHGFP vector expressing C-ter GFP (C) and pMS-QS-NHGFP vector expressing N-ter GFP (D). The arrow shows the purified protein band. Only elutions were loaded for analysis.

