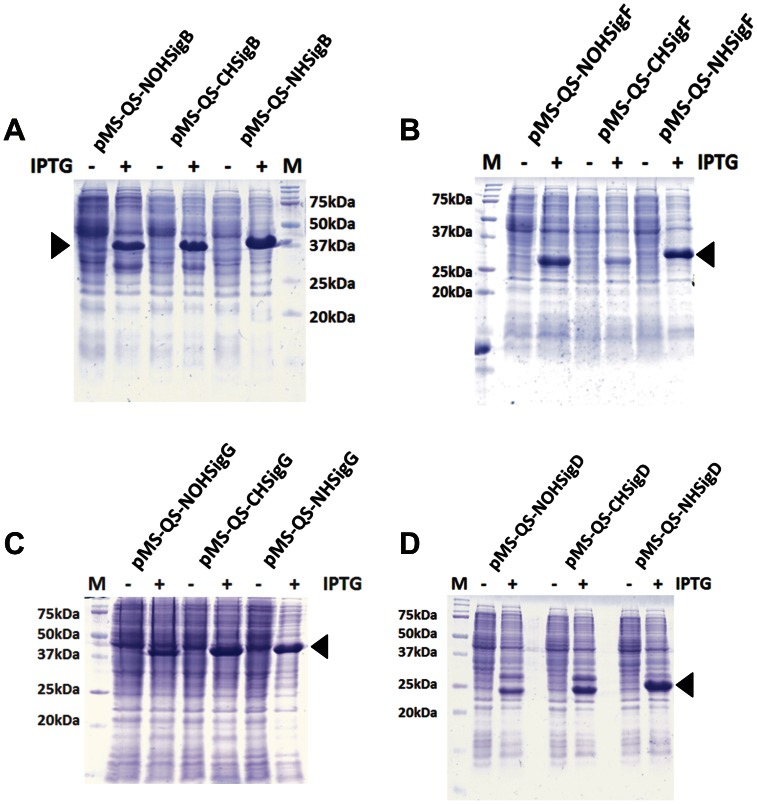
Figure 5. Expression analysis of M. tuberculosis sigma factors.
All sigma factors cloned in pMS-QS vectors were expressed in E. coli BL21(DE3) and were analyzed on a 15% SDS-PAGE gel. The gel images show protein profiles in the presence (+) and absence (−) of IPTG. Arrow points to the protein produced upon addition of IPTG only. Panels A, B, C and D correspond to SigB, SigF, SigG and SigD respectively. “M” represents protein molecular weight marker.

