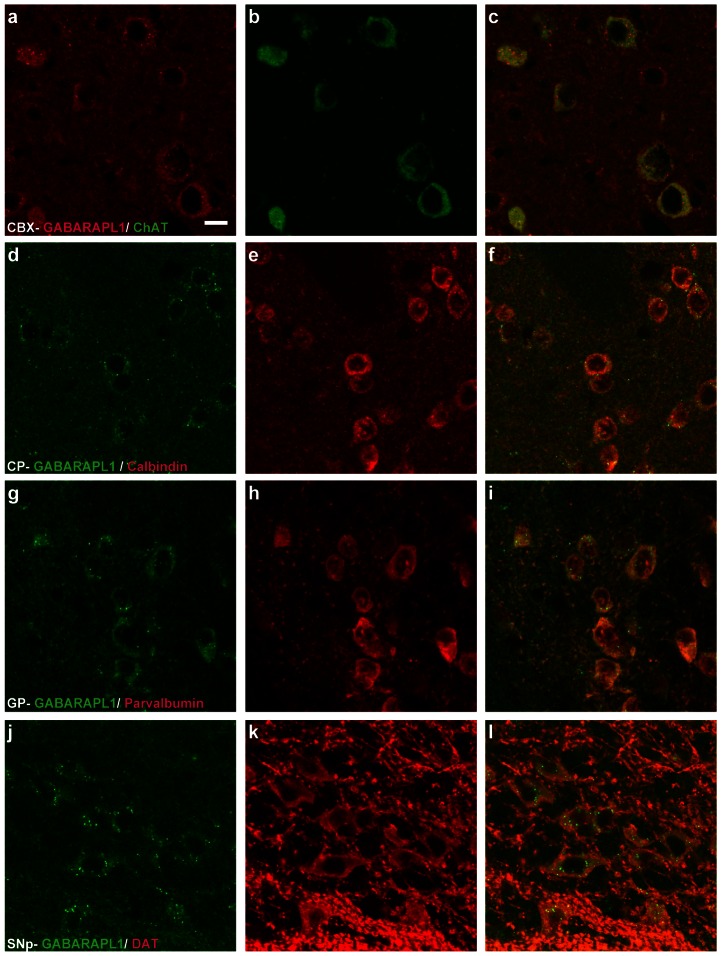
Figure 6. GABARAPL1 expression in different neuronal populations.
Immunohistochemical analysis of WT mouse brain tissue with an anti-GABARAPL1 antibody and different neuronal population markers. Images represent double staining with anti-GABARAPL1 and either anti-choline acetyltransferase in the cerebellar cortex-CBX (a–c), anti-calbindin in the caudate putamen-CP (d–f), anti-parvalbumin in the globus pallidus-GP (g–i) or anti-dopamine transporter in the substantia nigra, pars compacta-SNpc (j–l). Scale bar represents 10 µm.

