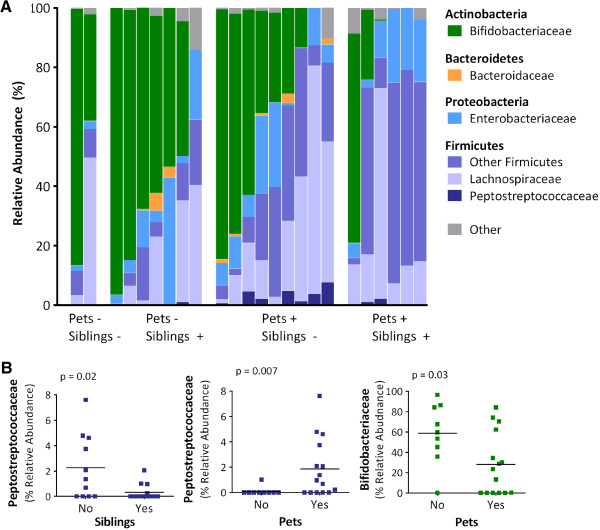
Figure 1.
Fecal microbiota composition for 24 infants (mean age 4 months) according to the presence of household pets and siblings. A) Relative abundance of dominant bacterial families; each column represents one infant. B) Selected differentially abundant families according to pets and siblings; bars indicate means. Relative abundance determined by 16S rRNA sequencing; comparisons conducted with Metastats (see Methods and Table 2).

