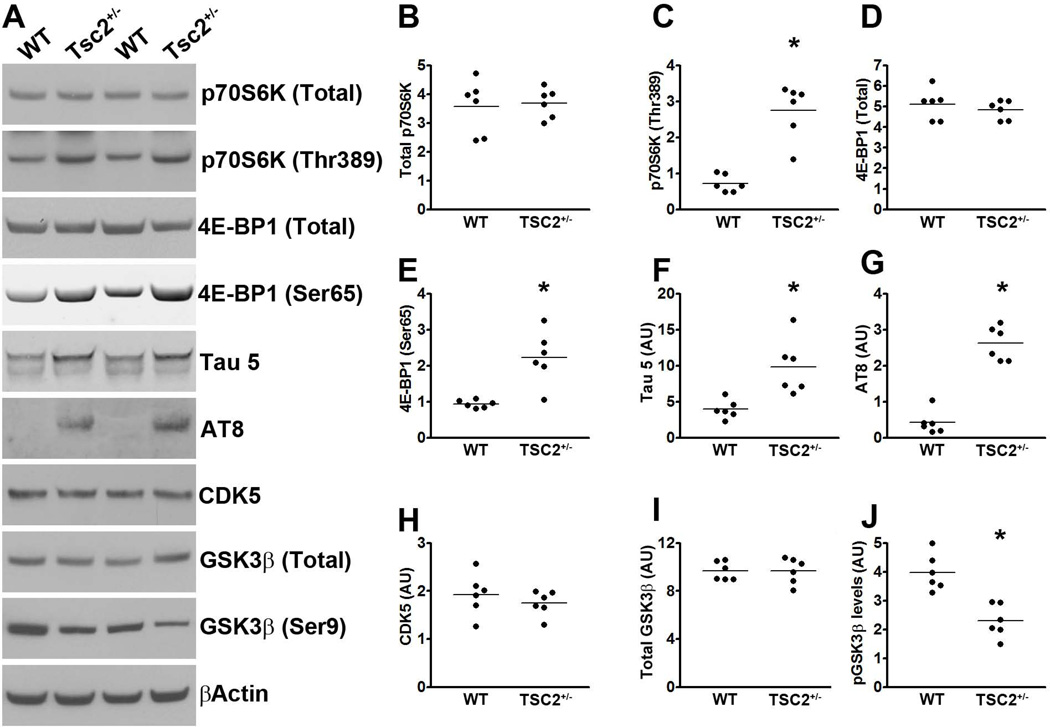
Figure 1. mTOR signaling inversely correlates with Tau levels and phosphorylation in TSC2+/− mice.
(A) Western blots of proteins extracted from the hippocampi of TSC2+/− mice and WT littermates, and probed with the indicated antibodies. (B-C) Quantitative analyses of total and phosphorylated p70S6K, respectively. Statistical analyses show that the levels of p70S6K phosphorylated at Thr389 were significantly higher in the hippocampi of the TSC2+/− mice compared to WT littermates. (D-E) Quantitative analyses of total and phosphorylated 4E-BP1, respectively, showed that the levels of 4E-BP1 phosphorylated at Ser65 were significantly higher in the hippocampi of the TSC2+/− mice compared to WT littermates. (F-G) Quantitative analyses of total (detected by the tau 5 antibody) and phosphorylated (detected by the AT8 antibody) tau showed that endogenous mouse levels were significantly higher in the hippocampi of the TSC2+/− mice compared to WT littermates. (H) Quantitative analyses of the CDK5 band showed no differences between the two groups of mice. (I-J) Quantitative analyses of the total and phospho-GSK3β bands, respectively. Statistical analyses indicated no changes in total GSK3β levels between the two groups. In contrast, the levels of GSK3β phosphorylated at Ser9 were significantly lower in the hippocampi of the TSC2+/− mice. Quantifications of the Western blots were done by normalizing the protein of interest to β-actin, which was used as a loading control. Data are presented as means ± SEM and analyzed by student’s t-test.

