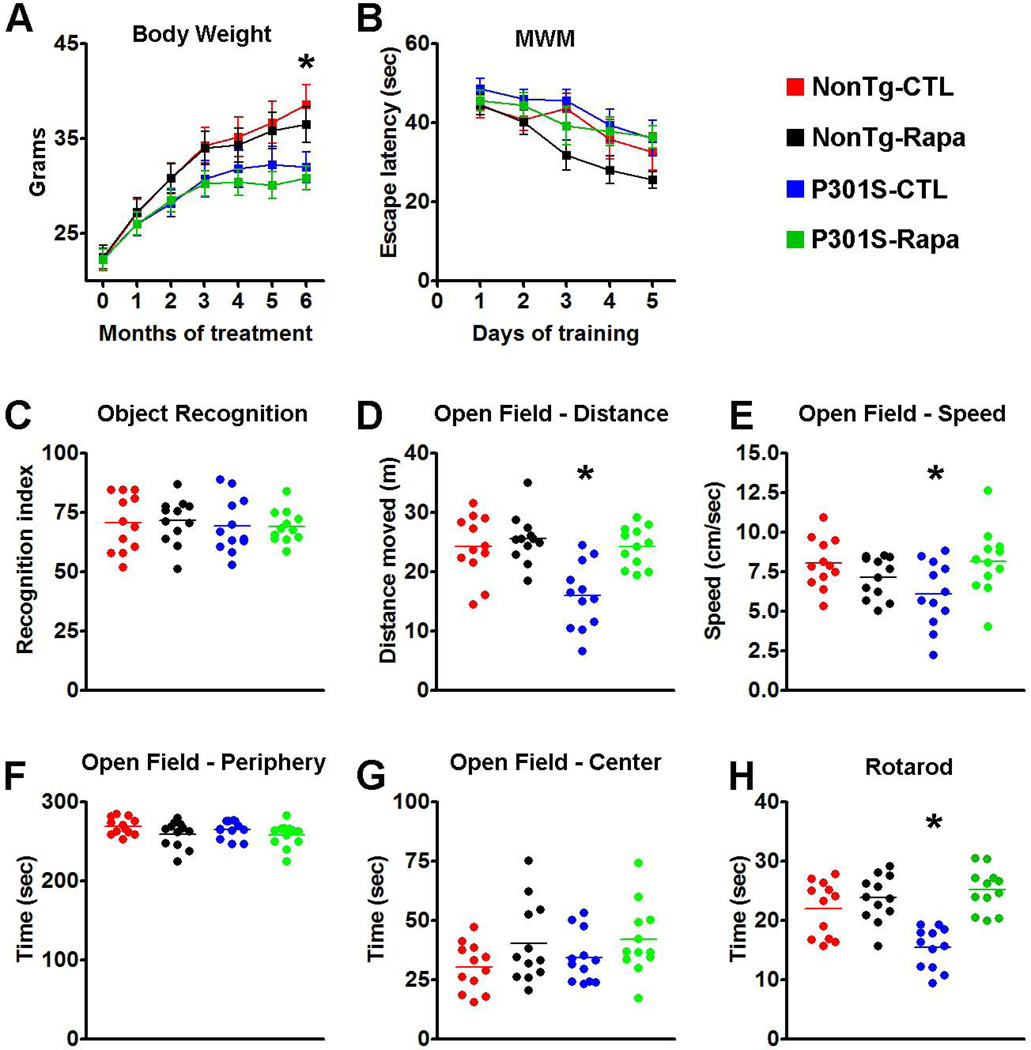
Figure 3. Rapamycin improves motor deficits in P301S mice.
(A) Transgenic P301S and NonTg mice were treated with rapamycin for 6 months. The graph shows the average body weight for each group of mice, measured monthly. Notably, the body weight of the P301S mice starts to plateau after 4 months of treatment while the WT mice gain weight throughout the treatment period. Statistical analyses indicated that this difference was linked to the genotype and was independent of rapamycin administration. (B) Learning curve depicting mice performance in the Morris water maze. All mice significantly learned the task over the 5 days of training, as indicated by a reduced time to find the escape platform; however, no statistically significant changes were detected among the groups. (C) Novel object recognition tests, a behavioral task highly dependent on the cortex, shows no differences among the 4 groups of mice. The graph depicts the recognition index, i.e., the percentage of exploration time that mice spend exploring the new object. (D-G) Open field activity measures spontaneous activity and anxiety. The data show that during the test, the P301S mice moved less (D) and at a slower speed (E) compared to the other three groups of mice. These changes were statistically significant. In contrast, no differences among the groups were found when measuring the time spent in the periphery and center of the arena (F and G, respectively), indicating that the P301S mice had no detectable anxiety defects and that rapamycin did not alter this normal condition. (H) The graph shows data obtained with the accelerating rotarod. Statistical evaluation indicated that the P301S-CTL mice were significantly impaired in this task and that rapamycin administration rescued this motor deficit. Indeed, the P301S-Rapa mice performed as well as the two NonTg groups. Data are presented as means ± SEM and were analyzed by two-way ANOVA followed by a Bonferroni test to determine individual differences among groups.

