Figure 3.
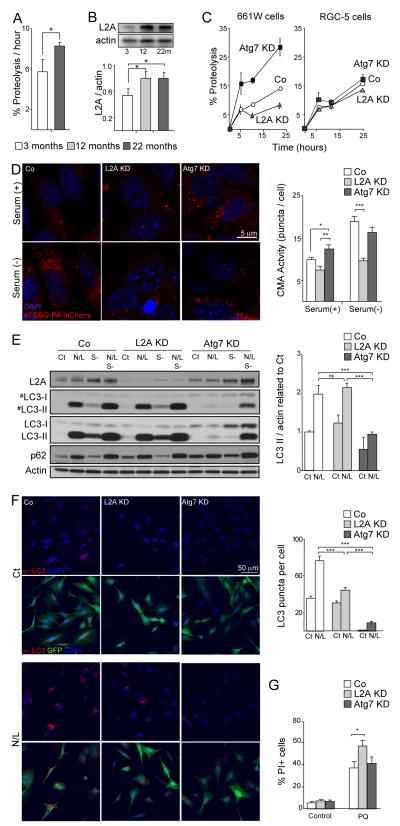
Perturbation of macroautophagy results in increased CMA. (A) Retinal proteolytic rates of long-lived proteins determined by metabolic labeling of the indicated ages mice retinas (n = 5), *p<0.05. (B) Western blot for LAMP-2A in the same samples and densitometric quantification (n = 10); *p<0.05. (C) Proteolysis determined as in A in 661W and RGC-5 cells in control (Co) and after Atg7 or LAMP-2A knockdown (KD) at the indicated times of the chase period (n=4). (D) CMA activity as determined with the fluorescent reporter KFERQ-PA-mCherry in control, Atg7 and LAMP-2A KD 661W cells maintained in the presence of serum (+) or in the absence of serum (-) for 16h. Representative images (left) and quantification of the number of puncta per cell (right) are shown. Scale bar as depicted. *p<0.05, ** p<0.01, ***p<0.005. (E) Autophagic flux as determined by western blot of LC3 in the same cell lines maintained in the presence or absence of serum and of the lysosomal inhibitors ammonium chloride and leupeptin (N/L). Left: representative immunoblot (#) lower exposure time immunoblot. Right: Densitometric quantification of LC3-II in A and autophagic flux determined as the ratio of LC3-II in the presence/absence of lysosomal inhibitors (n = 3). ***p<0.005. (F) Immunofluorescence of LC3 in the same cells maintained in the presence or absence of N/L. Left: top panels show LC3 (red) and DAPI (blue) channels. Bottom panels include GFP channel (green) to track the knocked down cells. Right: Quantification of the number of LC3 positive puncta per cell (n>300 cells). ***p<0.005. (G) Cell viability as determined by propidium iodine (PI) staining and flow cytometry in control, Atg7 and LAMP-2A KD 661W treated with or without 150 μM paraquat (PQ) (n = 10). *p<0.05.

