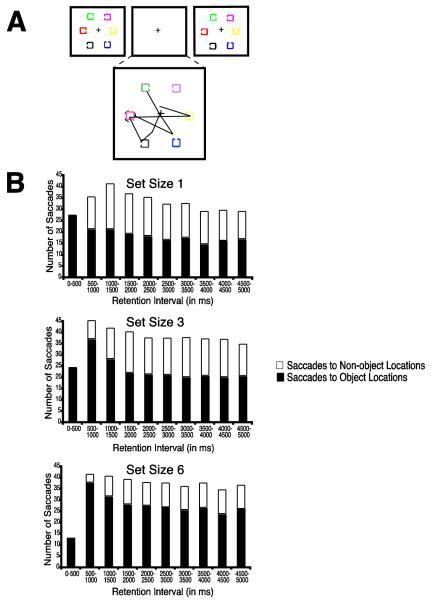
Figure 5.
Example of the eye movements during a trial and frequency histograms of the saccade endpoints during the trials. A) Actual eye-movement data from an example participant measured during the retention interval. In this example trial, the subject did fixate the changing item location (the red Landolt square rotated 180 ). Note the break in the scan path due to a blink during the 5-second retention interval. B) Latency histograms indicating the total number of saccades made to object locations as compared to non-object locations averaged across participants during the retention interval for Experiment 2B.

