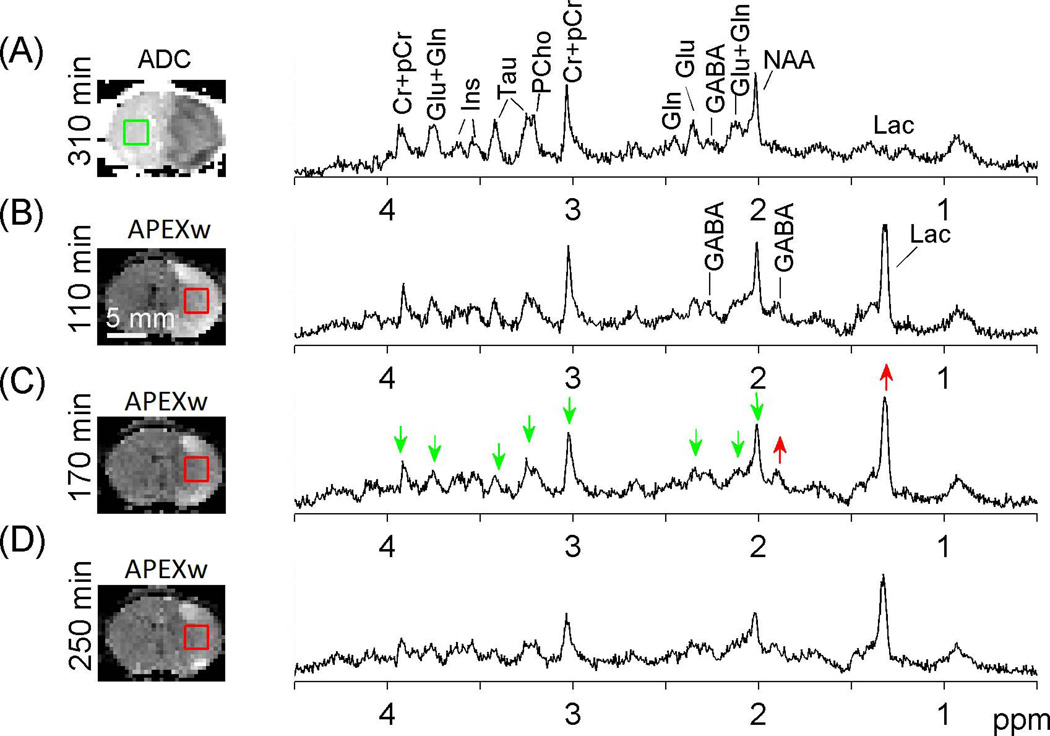
Figure 2.
Localized 1H MR spectra on the contralateral (A) and lesion (B – D) ROIs in a representative rat. The time for each measurement relative to the MCAO onset is given, and the ADC (A) and APEXw maps (B – D) measured at similar time points are displayed with the voxel locations for the spectroscopy measurements. Green and red arrows indicate metabolite peaks that were reduced and increased compared to the contralateral side, respectively. No smoothing was applied to the spectra.

