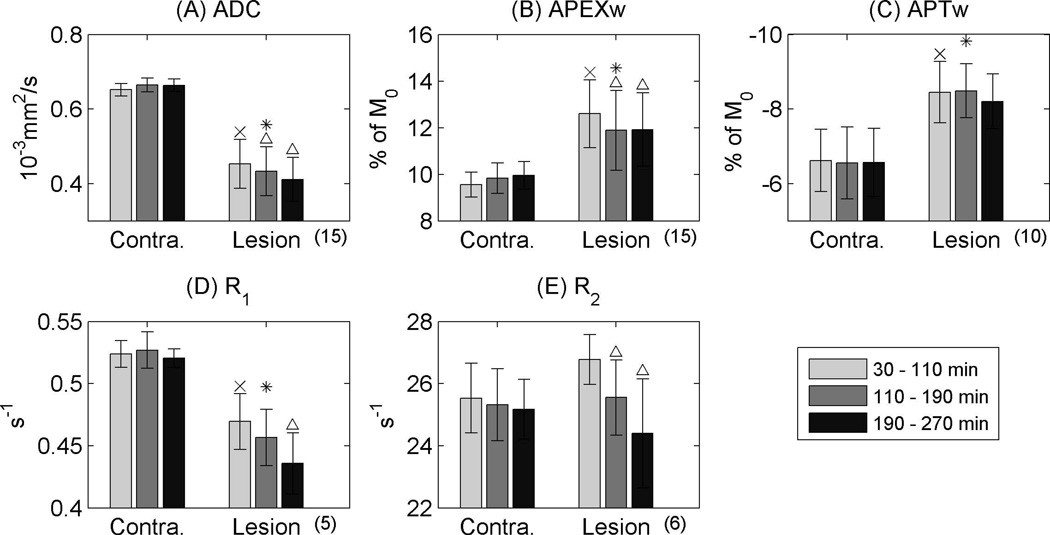
Figure 4.
Time dependence of group-averaged ADC (A), APEXw (B), APTw (C), R1 (D), and R2 (E). An ‘x’ mark indicates a significant difference of the first ischemic data point comparing to the contralateral side (paired t-test; p < 0.05 after Bonferroni correction). A ‘*’ sign denotes significant difference between the means of the lesion and contralateral sides (paired t-test; p < 0.05 after Bonferroni correction). A ‘Δ’ mark denotes p < 0.05 for a posteriori paired t-test when comparing the last two data points with the first data point when ANOVA reveals significant temporal dependence. Error bars denote standard deviations. The numbers in the parentheses below the x-axes are the numbers of animals used for each result.

