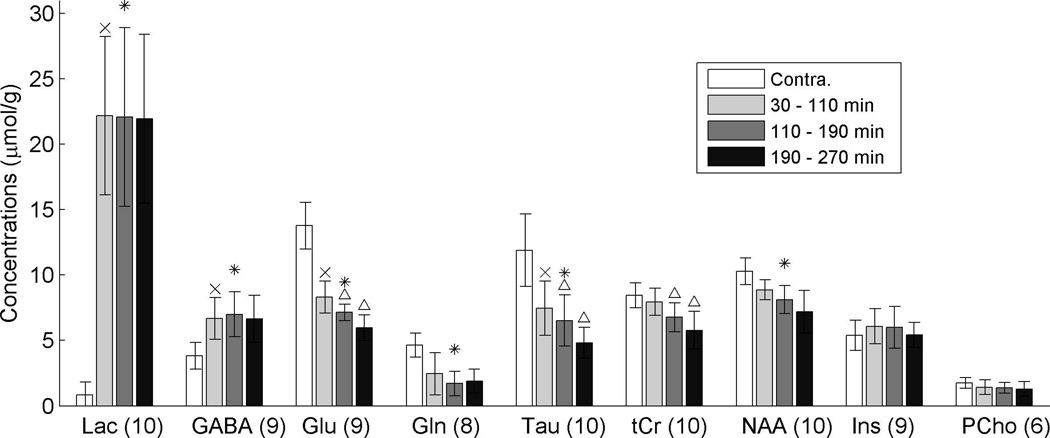
Figure 5.
Group-averaged metabolite concentrations as quantified by LCModel. The meanings of the ‘x’, ‘*’, and ‘Δ’ marks are the same as in Fig. 4. Error bars denote standard deviations. Only data with our CRLB criteria were included. The numbers next to each metabolite label are the numbers of animals used for each result.

