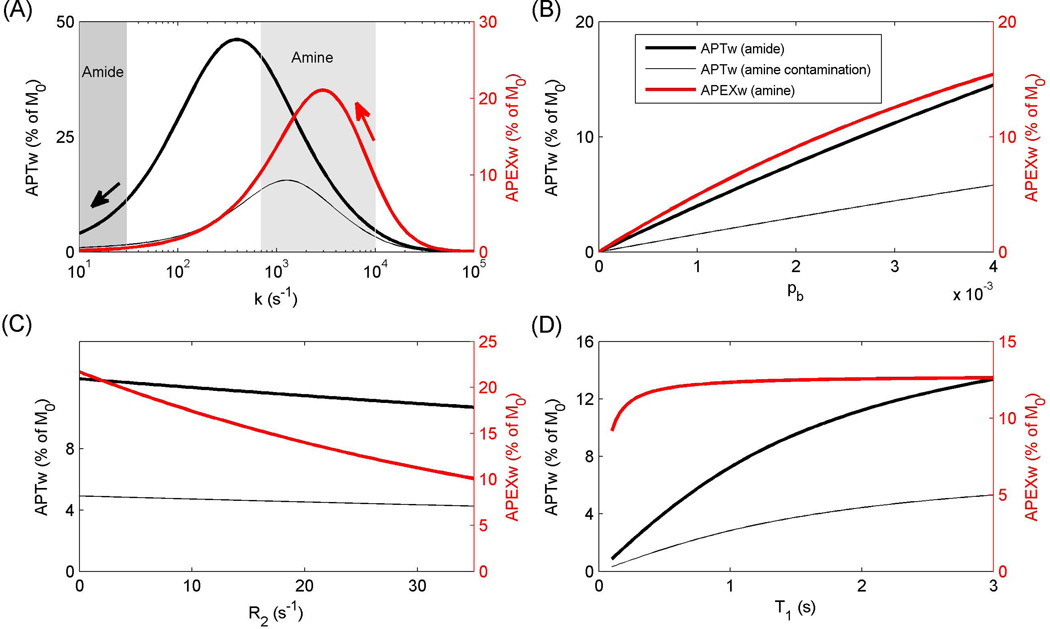
Figure 6.
Theoretical analyses of the dependences of APEXw and APTw on exchange rate (k) (A), labile proton concentration (B), R2 (C), and R1 (D). The labile protons were assumed to have a resonance frequency of 3.0 ppm (amine) or 3.5 ppm downfield from water (amide). In all panels, the parameter values were k = 8000 s−1 for amine and k = 30 s−1 for amide, pb = 0.003, R2 = 25 s−1, and R1 = 0.5 s−1, except for the parameter on the x axis. The shaded regions denote the ranges of the amide (10 – 30 s−1) and amine proton exchange rates (700 – 10000 s−1) (1,31). The red and black arrows denote the directions of APEXw and APTw changes, respectively, with decreasing pH under ischemia. APEXw refers to MTRasym at 2.5 ppm measured with the APEX-weighted spin-locking pulse sequence, and APTw refers to MTRasym at 3.5 ppm measured with the APT-weighted CEST technique. The thin gray curves indicate the contribution of amine–water proton exchange effect to APTw signals.

