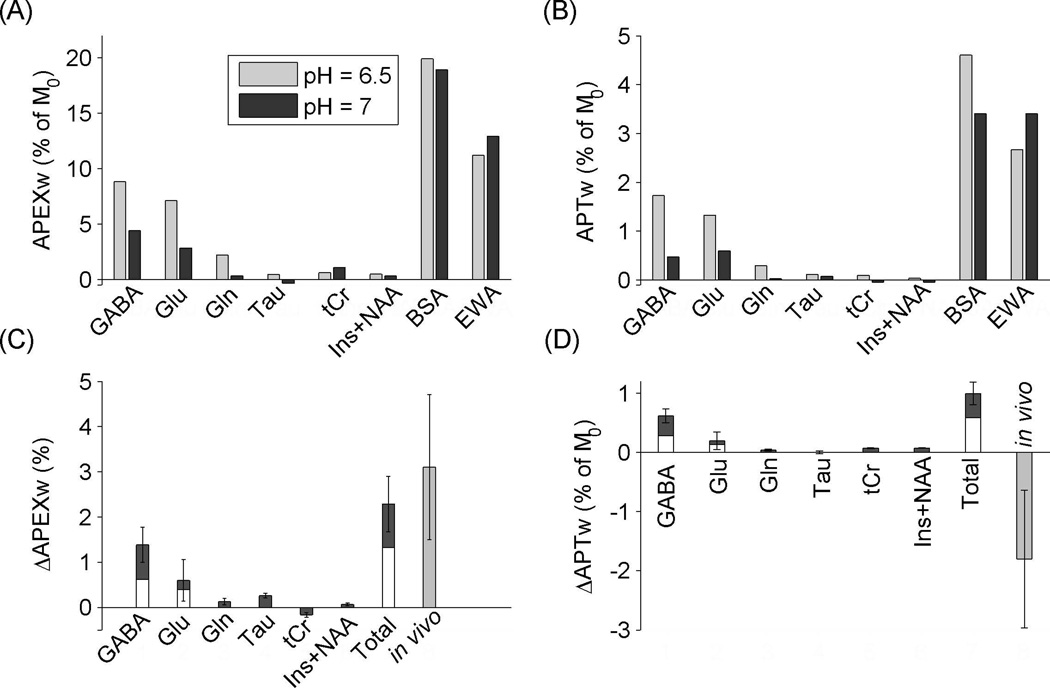
Figure 7.
Phantom data and estimated contribution of metabolites to in vivo APEXw and APTw changes. (A) APEXw and (B) APTw in metabolite and protein phantoms at pH of 7 and 6.5. The concentrations of the GABA, Glu, Gln, and Tau solutions are 20 mM, while the tCr solution contains 10 mM of Cr and PCr each and the Ins+NAA mixture solution contains 10 mM of Ins and NAA each. The concentrations of the BSA and EWA phantoms are 8% by weight. All measurements were performed at 37 °C at 9.4 T. (C) Expected APEXw and (D) APTw changes (ΔAPEXw and ΔAPTw) due to changes in pH (from 7 to 6.5) and in metabolite concentrations. Metabolite concentrations were obtained from in vivo data shown in Fig. 5 (Left two bars in each group), and its errors were propagated to standard deviations. The two bars on the right denote the sum of contributions from metabolites (Total) and the in vivo contrast, respectively. When our Glu and GABA concentrations were scaled to match values from literatures (33–36) for the contralateral side, their contributions are shown as white bars. APEXw refers to MTRasym at 2.5 ppm measured with the APEX-weighted spin-locking pulse sequence and APTw refers to MTRasym at 3.5 ppm measured with the APT-weighted CEST technique.

