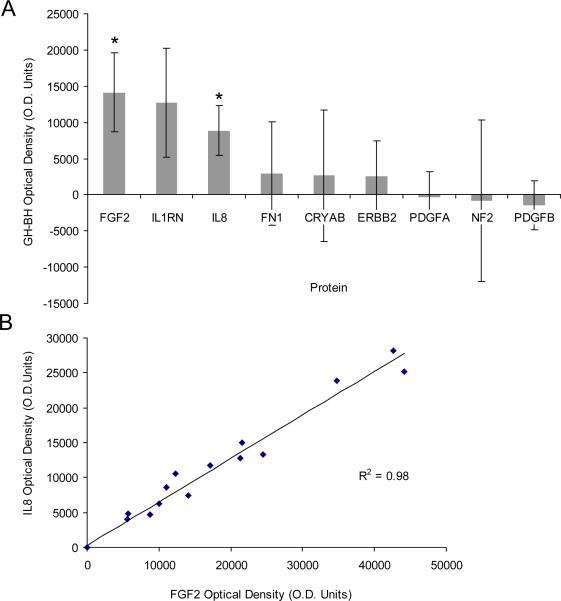
Figure 2.
Cytokine srray results for 37 proteins studied. Means and SEM are plotted for secretions from VS associated with GH (solid gray columns, n=11) and PH (backward shaded columns, n=10) and control GAN (forward shaded columns, n=7). (A) Protein secreted at higher levels in VS associated with GH versus PH; (B) Proteins secreted at higher levels in VS associated with PH versus GH. IL1B, IL10, IL12B, 1L13, IL15, IL17, TNFB and CEA are not shown as they were not significantly secreted in VS or GAN. Statistical significance of *p≤0.05 or **p<0.01 refers to VS secretions (combining GH and PH) versus GAN secretions.

