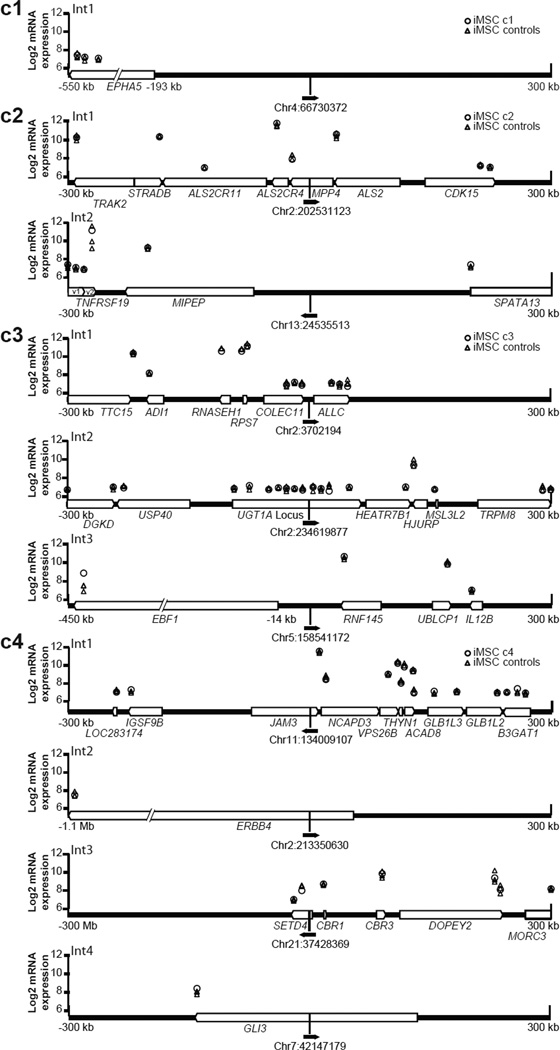
Figure 3. Provirus locations and neighboring gene expression in iMSCs.
The vector proviruses found in each clone are shown with chromosomal location (February 2009 freeze of the human (hg19) genome) and a solid black arrow in the direction of vector transcription. Cellular genes within a 300 kb window up- or downstream of each provirus are shown as white block arrows in the direction of transcription. Micorarray probe signal levels are shown above their chromosomal positions as log2 values. Probe signals from each iMSC clone containing the integrant (○) were compared to the remaining three iMSC clones as controls (△). Int1–Int4 identifies distinct integration sites within each clone.

