
Figure 2. Proliferation of T. gondii in RAMs.
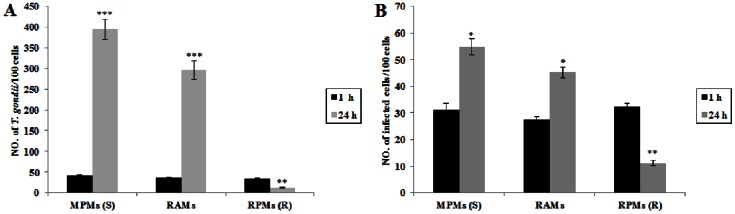
(A) Number of T. gondii/100 cells. (B) Number of infected cells/100 cells. Data in A and B represent a mean ± SEM calculated from 3 independent experiments performed in triplicate. Probabilities *p<0.05, **p<0.01, and ***p<0.001, (ANOVA), indicate a significant difference from infection at 1 hr in MPMs (S), RAMs and RPMs (R) respectively (S: susceptible; R: resistant).