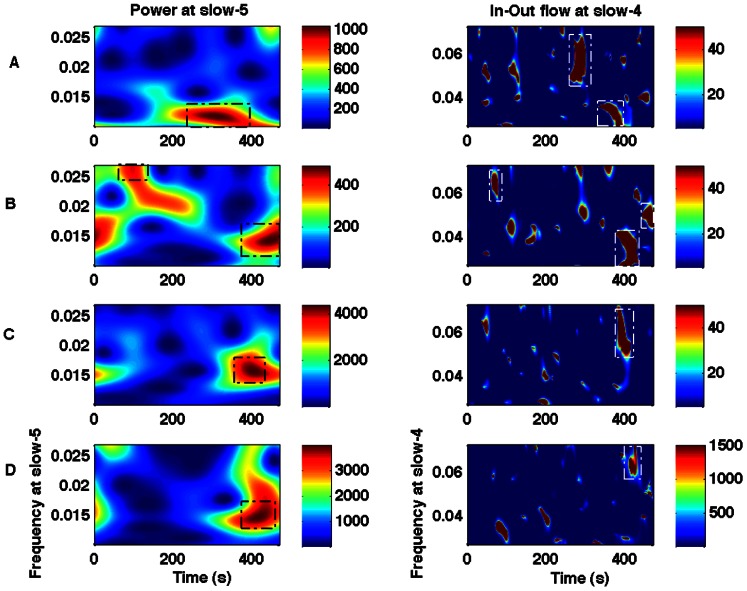
Figure 5. Wavelet power and in-out causal flow.
Power at slow-5 frequency (left column) and in-out flow at slow-4 frequency (right column) for regions: (A) PCC, (B) mPFC, (C) LMTC, (D) LAG. Dotted boxes are used to highlight that the higher values of power and the in-out flow originate at around the same time points but at different frequencies as for the pair (slow-4 power, slow-3 net causal flow) as shown in figure 4.

