
Figure 9. Structure-function relation.
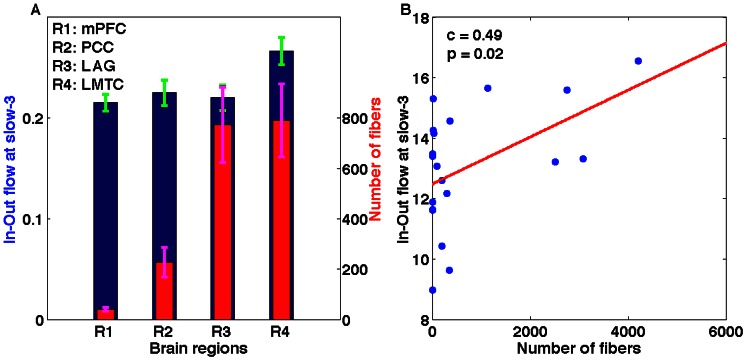
The maximum in-flow and number of fibers for all the regions have been plotted: (A) the maximum in-flow at slow-3 (blue bars) averaged over all participants for each region and corresponding number of fibers (red bars) averaged over all participants for the corresponding regions, and (B) a positive significant linear relation between the in-out flow at slow-3 and the number of fibers connecting all four regions in 6 participants who underwent both DTI and fMRI scanning.