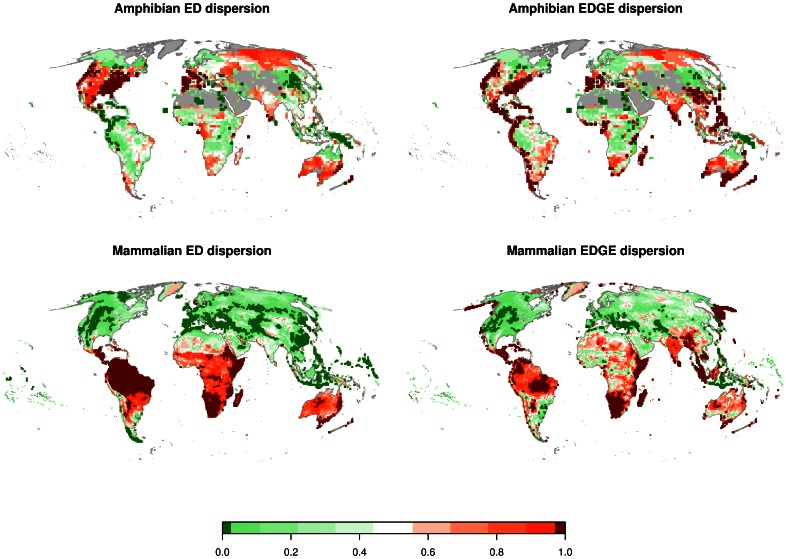
Figure 2. Quantile assignment of communities according to an empirical distribution function generated by 1000 randomisations.
The quantile assignment indicates for each grid cell the probability of occurrence for the realised cumulative ED/EDGE value compared to 1000 randomly composed communities of equal size. Range size of the species was included in the random selection procedure to account for the fact that wide spread species are more likely to constitute a part of communities than rare and local species, and therefore a correlation between range size and ED/EDGE without taking range size into account would bias the probability distribution. The dark red and dark green areas represent areas of higher than 97.5% and lower than 2.5% probability respectively (corresponding to a p-value in two tailed statistic testing of ≤5%).

