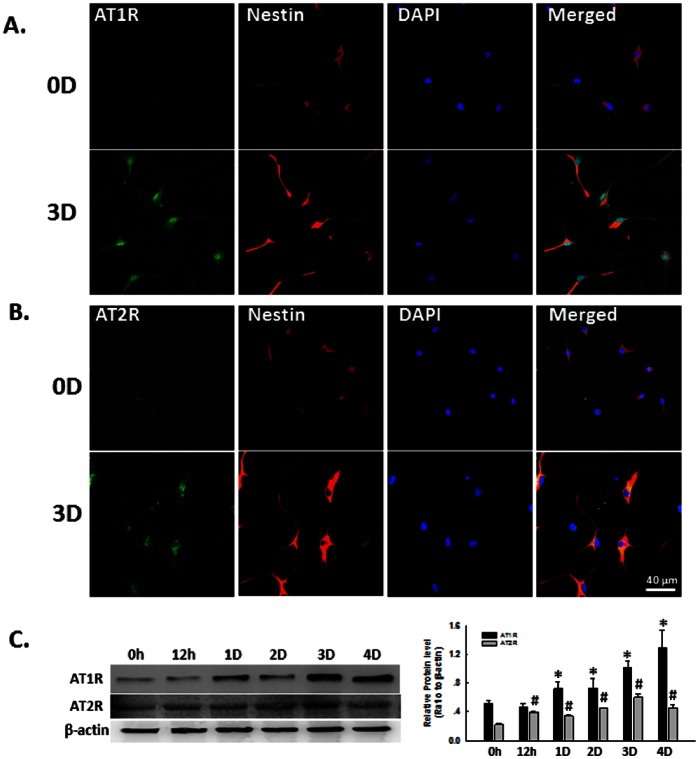
Figure 2. Expression pattern of AT1R and AT2R in NSCs.
A) Representative immunofluorescence images showing the AT1R expression in NSCs. 0D: 0 day; 3D: 3 days. NSCs cultured at day 0 or day 3 were fixed with 4% paraformaldehyde followed by immunostaining for nestin (red), a neural stem cell marker, and AT1R (green). DAPI (blue): nuclei marker. Scale bar:40 µm. B) Representative immunofluorescence images showing the AT2R expression in NSCs. NSCs cultured at day 0 or day 3 were fixed with 4% paraformaldehyde followed by immunostaining for nestin (red) and AT2R (green). DAPI (blue): nuclei marker. Scale bar:40 µm. C) Representative blots (left panel) and mean data of relative blot density (right panel) showing expression pattern of AT1R and AT2R in NSCs. Expression of AT1R or AT2R was determined from NSCs cultured for 0 hour, 12 hours, 1 day, 2 days, 3 days and 4 days by Western Blot analysis. *P<0.05 vs AT1R expression in NSCs cultured at 0 hour; #P<0.05 vs AT2R expression in NSCs cultured at 0 hour, n = 3 in each group.

