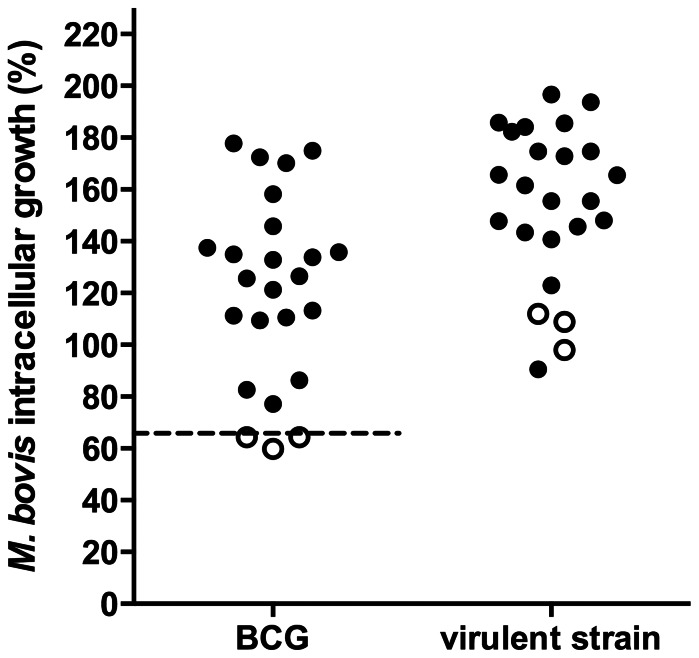
Figure 1. Bovine macrophage BCG growth control as an indicatior of a natural disease resistance phenotype.
Adherent-macrophages were infected with BCG Danish strain or M. bovis field strain 9926 (MOI of 10) for 4 h, washed and cultured again for 24 h. Bacterial intracellular growth was calculated by dividing the number of intracellular CFU at 24 h post-infection by the number of intracellular CFU at the start of the assay. The figure shows the percentage of M. bovis growth in macrophages of 24 cows. For BCG values below or equal to the cut-off point of 65% growth (dotted line) are indicative of resistant cattle (white symbols) while values higher than 65% are a sign of susceptibility (black symbols). Plots are mean of triplicates of two independent experiments of each animal.

