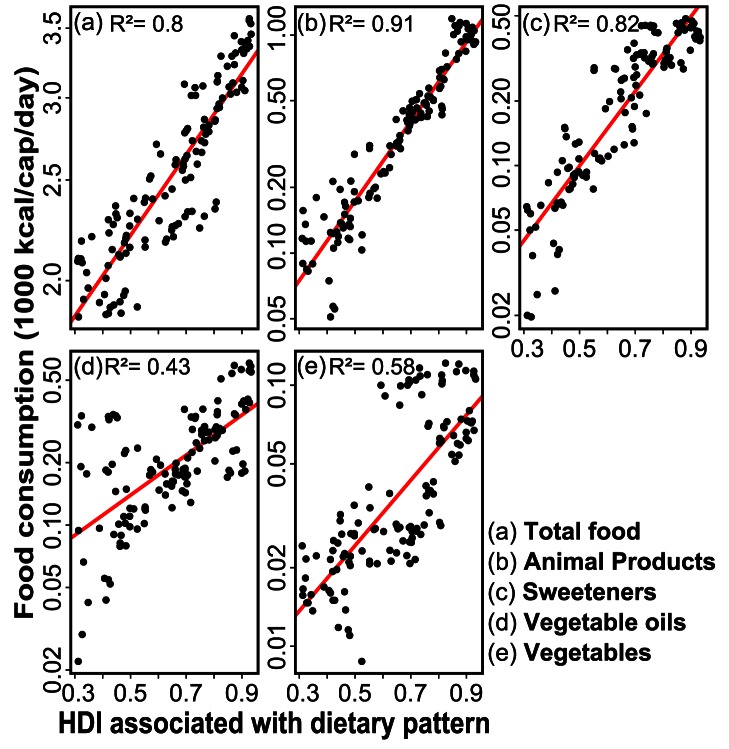
Figure 2. Relation between development (HDI) and consumption of total food (a), animal products (b), sweeteners (c), vegetable oils (d) and vegetables (e).
Average values for each dietary pattern and year are shown. Note that the  -axis is in logarithmic scale, implying that a linear shape corresponds to an exponential relation.

