
Figure 3. Number of people living on a certain dietary pattern for each year (1961–2007).
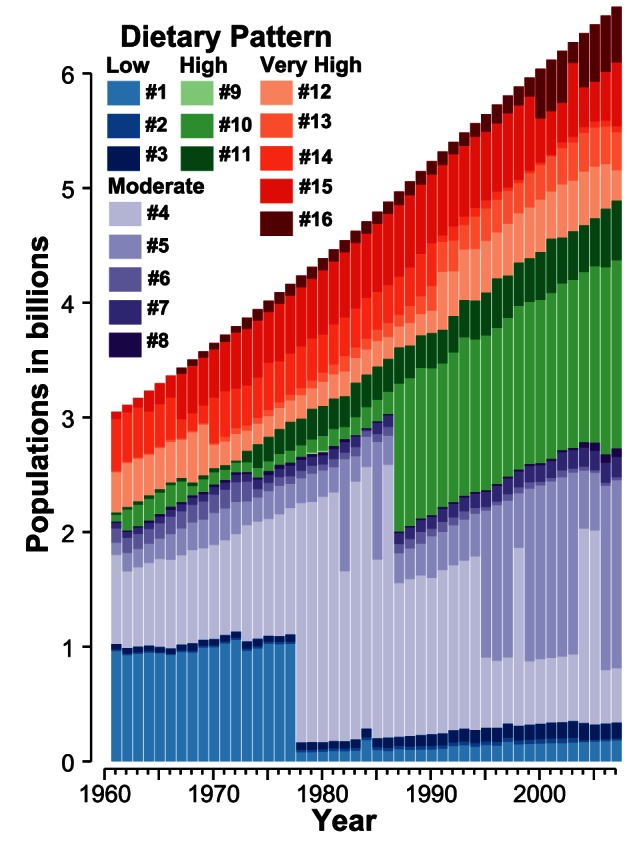
The color codes represent the sixteen dietary patterns. The huge changes in the number of people consuming low calorie diets from 1977 to 1978 and on moderate calorie diets from 1986 to 1987 are due to dietary transitions in China. The huge fluctuation in the number of people consuming pattern #4 and pattern #5 diets (e.g. on 1982, 1985, 1995, etc.) is mainly because of shifting membership of India between pattern #4 and pattern #5. Note that pattern #16 newly emerged in the middle of the 1960ties.