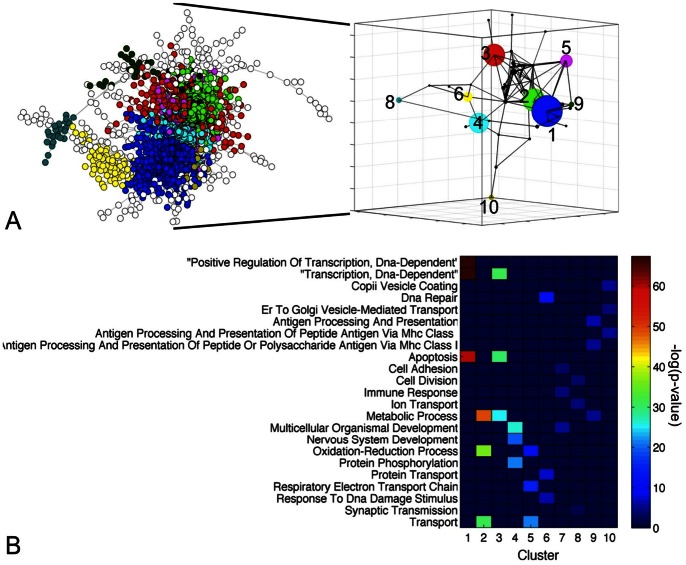
Figure 2. GEP-NEN gene co-expression network.
A) Visualization of the GEP-NEN gene co-expression network (2545 genes, 30249 edges). Each node represents a gene, while a link represents a GEP-NEN-specific co-expression. Nodes that localized to the same network community are marked in the same color. The community structure of the GEP-NEN network is further visualized in the 3 dimensional inset, whereby each node represents a community while edges are drawn between communities that contain co-expressed genes. Larger nodes indicate bigger gene communities. B) Heatmap visualizing enrichment for over-represented Gene Ontology (GO) Biological Process (BP) terms assigned to the 10 largest clusters (>20 genes). Heatmap colors represent the significance of the enrichment.

