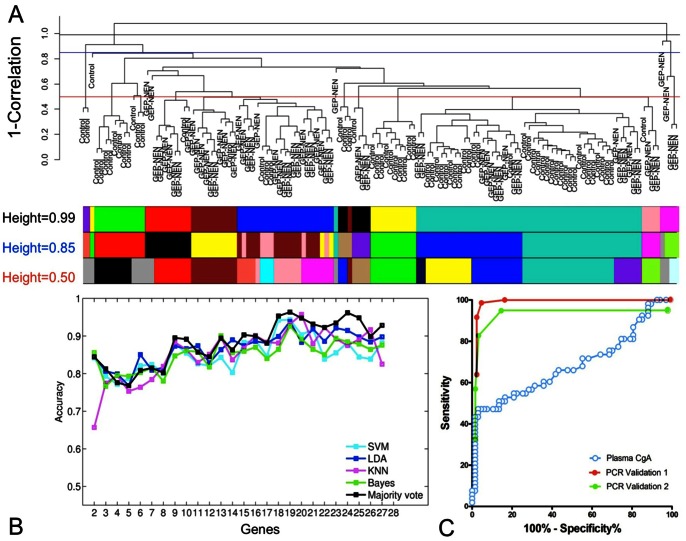
Figure 3. Utility of the 51 marker gene signature for identification of GEP-NEN disease.
A) Unsupervised hierarchical clustering of the 130 samples in the training set (n = 67 controls, n = 63 GEP-NENs). Tree was generated with an average agglomeration method and 1-(sample correlation) was used as a measure of dissimilarity. Unique colors under the dendrogram represent sample cluster assignments, computed by cutting the hierarchical tree at height = 0.99 (black line), 0.85 (blue line), or 0.50 (red line) using a dynamic tree cutting approach [77]. B) Prediction accuracy of each classifier using sequential addition of 27 significantly up-regulated genes (p<0.05) in the GEP-NEN samples obtained using results of the 10-fold cross validation. C) Receiver operating characteristic (ROC) curves for “majority vote” classifier applied to validation sets 1 (AUC = 0.98, p<0.0001) and 2 (AUC = 0.95, p<0.0001) compared to ROC curve for utility of the plasma CgA values (AUC = 0.64, p<0.002). Direct comparisons of AUCs between set 1 or set 2 and CgA identified estimated Z-scores of 10.57 and 11.42 respectively, confirming the significant differences between the two detection systems (calculations detailed in Supplementary Methods ).

