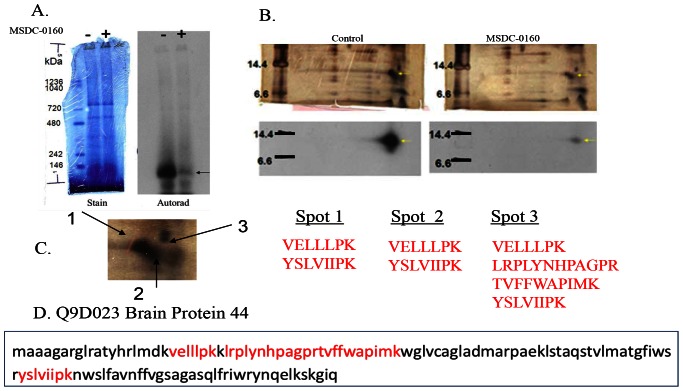
Figure 2. Crosslinked protein is BRP44.
(A) Blue Native electrophoresis of crosslinked proteins showing the stain pattern (left) and the corresponding autoradiogram image for the specifically crosslinked protein (without, “−”on the left and with MSDC-0160 competition, “+”, on the right). The <150 kDa band is marked by the arrow. (B) Second dimension SDS separation of Blue Native gel without (left) and with (right) MSDC-0160 competition. Upper figures are silver stained images of the gels and lower figures are corresponding autoradiograms. Areas of interest are marked by the yellow arrows. (C) Expanded view of silver-stained images showing the three areas submitted for MS/MS analysis followed by the respective trypsin peptide sequences. These peptides (shown also in red, bottom frame D) identify BRP44 (Q9D023).

