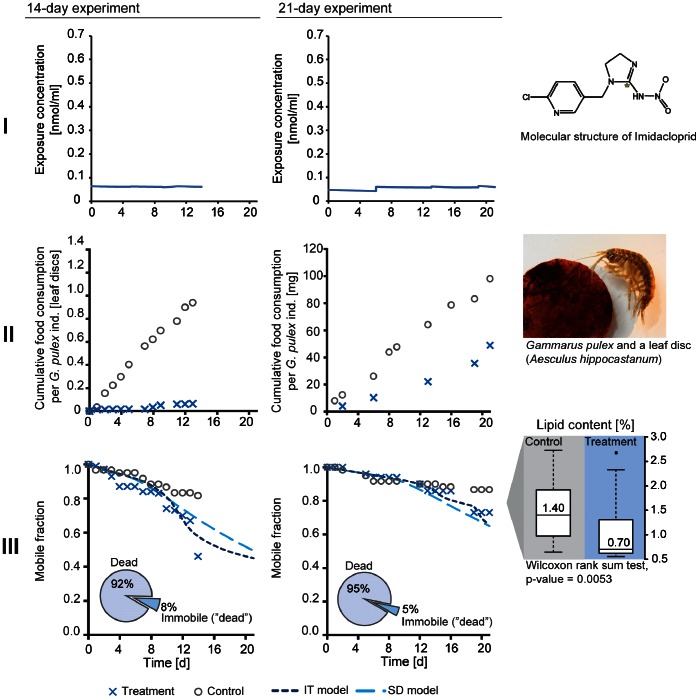
Figure 1. Feeding, lipid content, and survival of Gammarus pulex under constant exposure to imidacloprid.
Imidacloprid concentrations in medium (I), cumulative food consumption (II), mobile fraction of individuals, and lipid content (% of total wet weight) of Gammarus pulex (III) in the constant treatments (C) and controls of 14-day and 21-day experiments. Pie charts show the percentage of dead and immobile individuals amongst those removed from the beakers (non-mobile individuals = immobile+dead).

