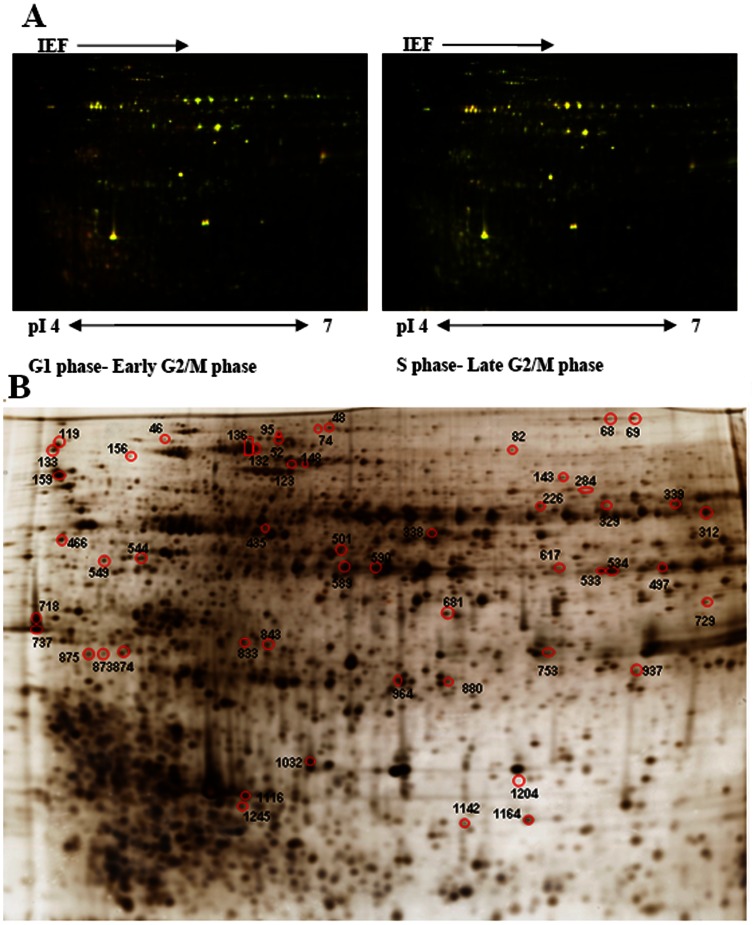
Figure 3. 2-D DIGE analysis of P. donghaiense at the different cell cycle phases.
(A) Representative 2-D DIGE image for protein expression maps using a 12% homogeneous SDS-PAGE gel with the pH range from 4 to 7. (B) Differentially expressed protein spots determined using DeCyder software. Each gel is representative of three independent replicates. 53 protein spots presenting statistically significant alterations in abundance were identified.

