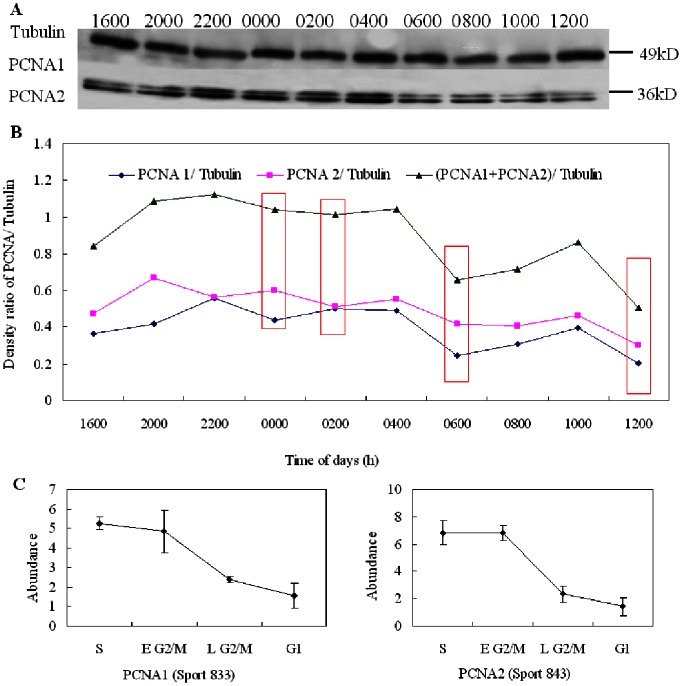
Figure 5. Western blot analysis of PCNA in P. donghaiense cells during the cell cycle.
Intensities of the proteins were normalized to the corresponding tubulin level. (A) Representative western blots. (B) Western blot results from densitometry analysis. Pink rectangles represent four cell cycle phases. (C) Abundance variations of PCNA1 and PCNA2 in four cell cycle phases in 2-D DIGE gels. The alteration in abundance of PCNA was generally consistent with the variations in 2-D DIGE analysis, which was up-regulated in the S and early G2/M phases and was down-regulated in other cell cycle phases.

