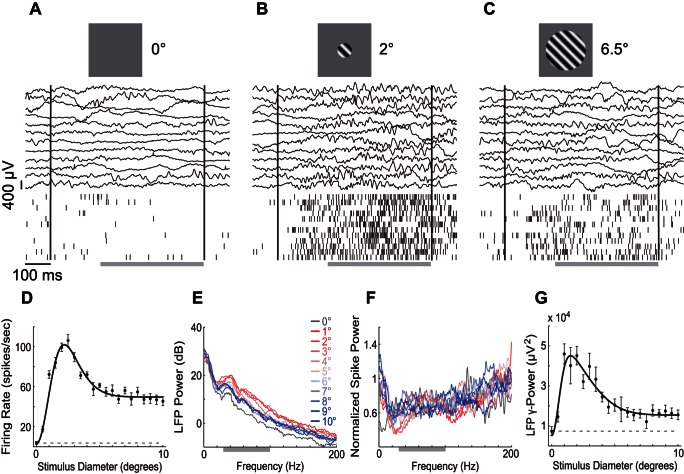
Figure 2. Size-tuning responses of a sample recording site.
(A–C) Multi-unit and LFP responses to the enlarging drifting gratings. Black vertical lines indicate the stimulus onset and offset times. The gray horizontal bars indicate the sustained response windows. (D) Size-tuning curve of the sustained response of mean firing rate. The data points indicate the mean ± SE. The solid line is the DoG function fitted from the data, with Adjust-R2 = 0.951. The dashed line indicates the response level of uniform background control. (E) LFP power spectrum of different stimulus sizes. The gray bar indicates gamma band. (F) Normalized spike power spectrum of different stimulus sizes. The color code is identical to that of (E). (G) Size-tuning curve of sustained gLFP. The Adjust-R2 of the fitted DoG was 0.871. The legends are identical to those of (D).

