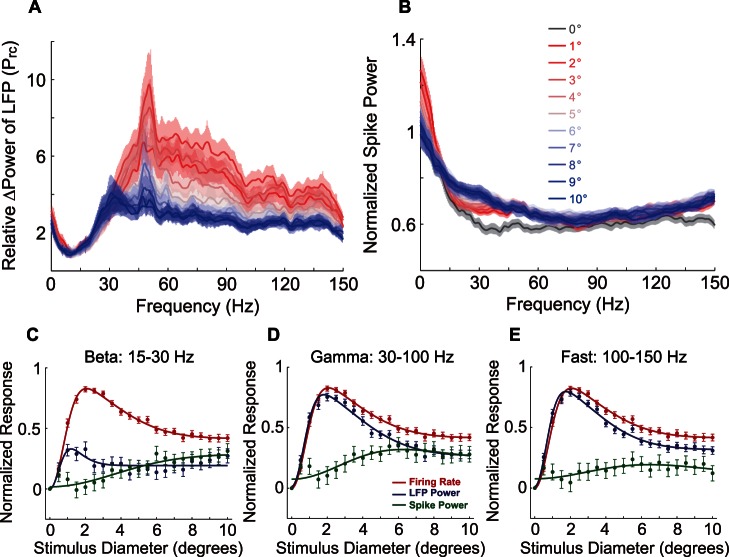
Figure 3. Population average responses of increasing stimulus size.
(A) Relative change of LFP power spectra with increasing stimulus size. For the sake of illustration, the data were smoothed by a 5 Hz Sgolay filter. The color shade stripes indicate the standard error. (B) Normalized spike power spectra of different stimulus sizes. The legends are identical to those of (A). (C–E) Size-tuning curves of mean power of LFP (blue) and spikes (green) at different bands, along with that of mean firing rate (red). The data points are the population-averaged responses and their standard error. Solid lines indicate the fitted DoG function. The Adjust-R2s of LFP power were 0.523, 0.973, and 0.978 in beta, gamma, and fast band, whereas those of spike power were 0.801, 0.747, and 0.353 in the three bands, respectively. The Adjust-R2 of firing rate was 0.992.

