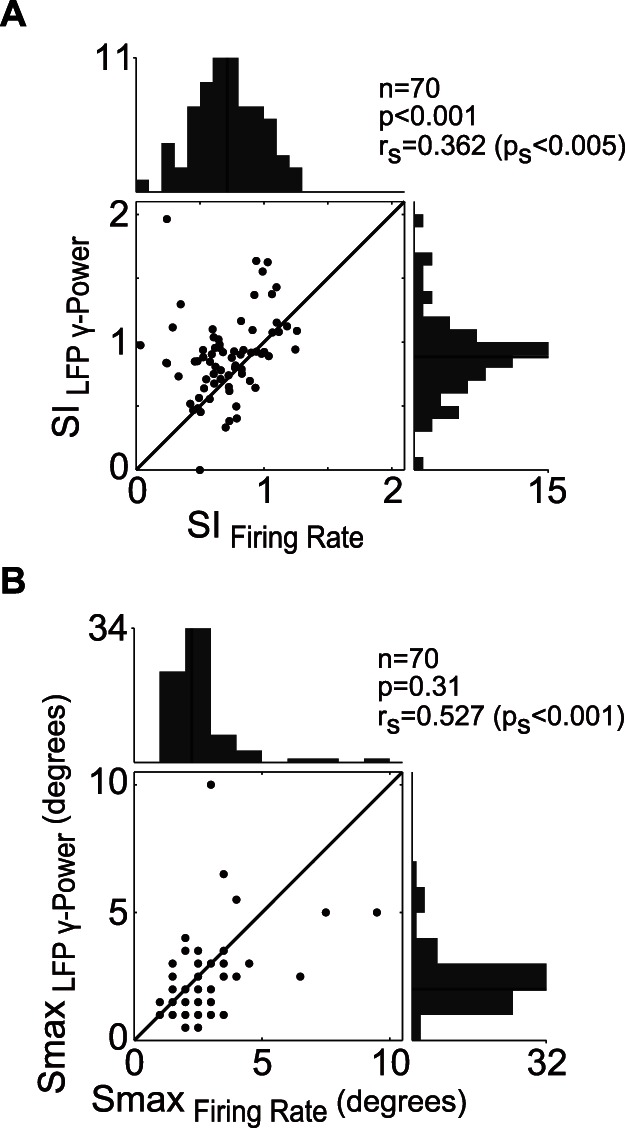
Figure 4. Comparison of firing rate and gLFP surround suppression characteristics.

(A) Pairwise comparison of suppression indexes. Black lines in histograms represent the median. The two distributions were significantly different and correlated (Wilcoxon signed-rank test, rs is the Spearman rank correlation coefficient). (B) Distributions of stimulus size that produce maximum response. No significant differences were observed, although, they were significantly correlated. The legends are identical to those in (A).
