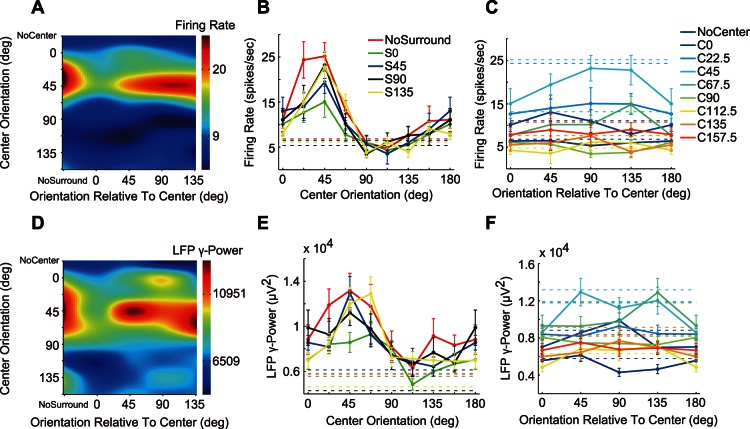
Figure 5. Responses of a sample recording site to the center-surround compound stimulus set.
The upper row (A–C) shows firing rate responses and the lower row (D–F) shows the gLFP responses. (A, D) Response of center-surround compound stimulus set. For the sake of illustration, data were interpolated four times by a 2D third-order spline. (B, E) Center orientation tuning curves of firing rate and gLFP under different surround orientations. The data points represent the mean ± SE. The dashed lines indicate responses with no center stimulus. (C, F) Orientation tuning of surround suppression under different center orientations. The dashed lines indicate responses with no surround stimulus.

