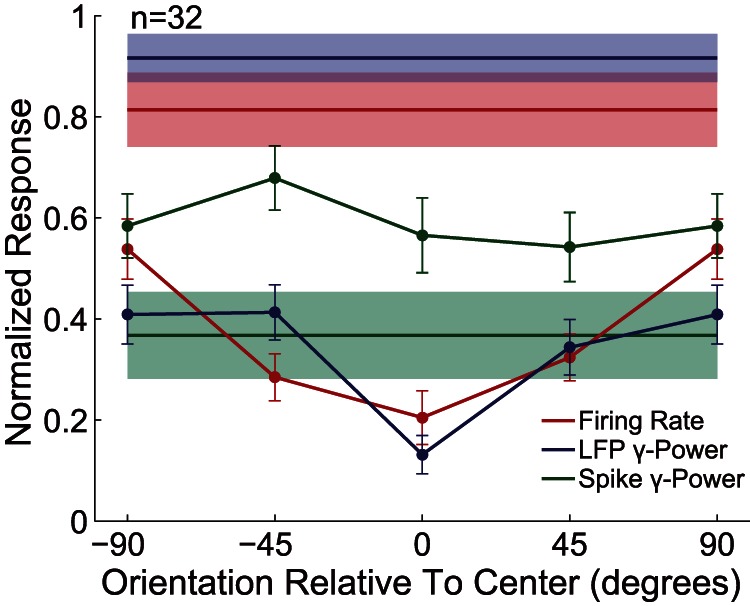
Figure 6. Population-averaged orientation tuning of surround modulation.

Horizontal lines and shadings indicate the mean ± SE of CRF stimulation without the surround stimulus. The Data points represent the mean ± SE under different surround orientations.
