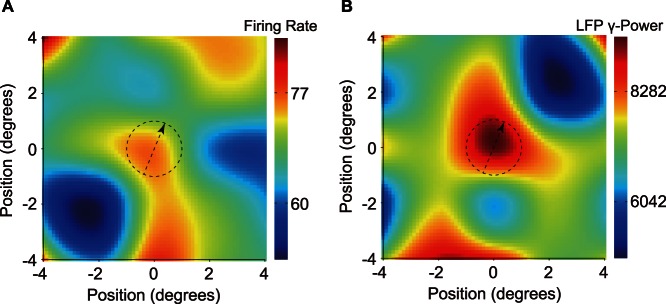
Figure 7. Spatial distribution of surround suppression of a sample recording site.

Surround suppression was not always uniform for the firing rate (A) and gLFP (B). In this recording site, both responses had a distinct LSR of similar sizes. These LSRs did not overlap, but were aligned to the optimal direction. The dashed circle indicates the SSF size and position. The dashed arrow indicates the optimal direction of firing rate, which was also the drifting direction of all stimuli. For the sake of illustration, the data were interpolated four times by a 2D third-order spline.
