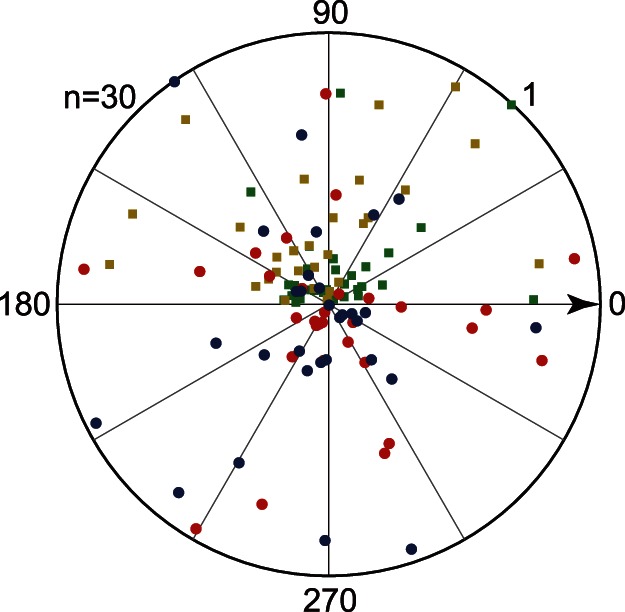
Figure 8. Asymmetry vector and axial asymmetry vector of firing rate and gLFP.

Population distributions of the AV of the firing rate (red circle) and gLFP (blue cycle), as well as the AVa of the firing rate (yellow square) and gLFP (green square). The AV angle was rotated so that the optimal direction always horizontally points to the right (black arrow).
