
Figure 9. The asymmetric properties of surround suppression.
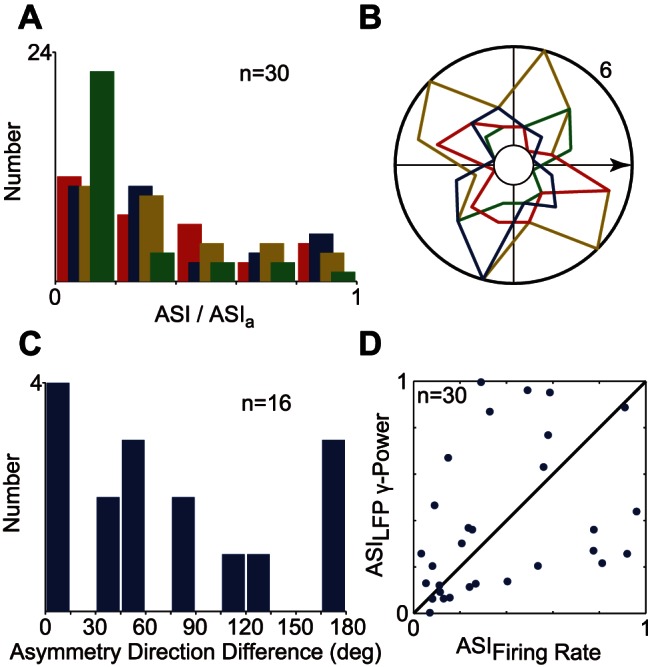
Distributions of ASI, ASIa (A), and AD, ADa (B) are differentiated by color. Red and blue represent asymmetric properties for MFR and gLFP. Yellow and green represent axial asymmetric properties for MFR and gLFP. AD and ADa analyses were only performed when corresponding ASI or ASIa was larger than 0.2. The horizontal arrow indicates the optimal direction. (C) AD difference between the MFR and gLFP when the corresponding ASIs were both larger than 0.2. (D) ASI correlation of MFR and gLFP (r = 0.36, P = 0.048, t-test).