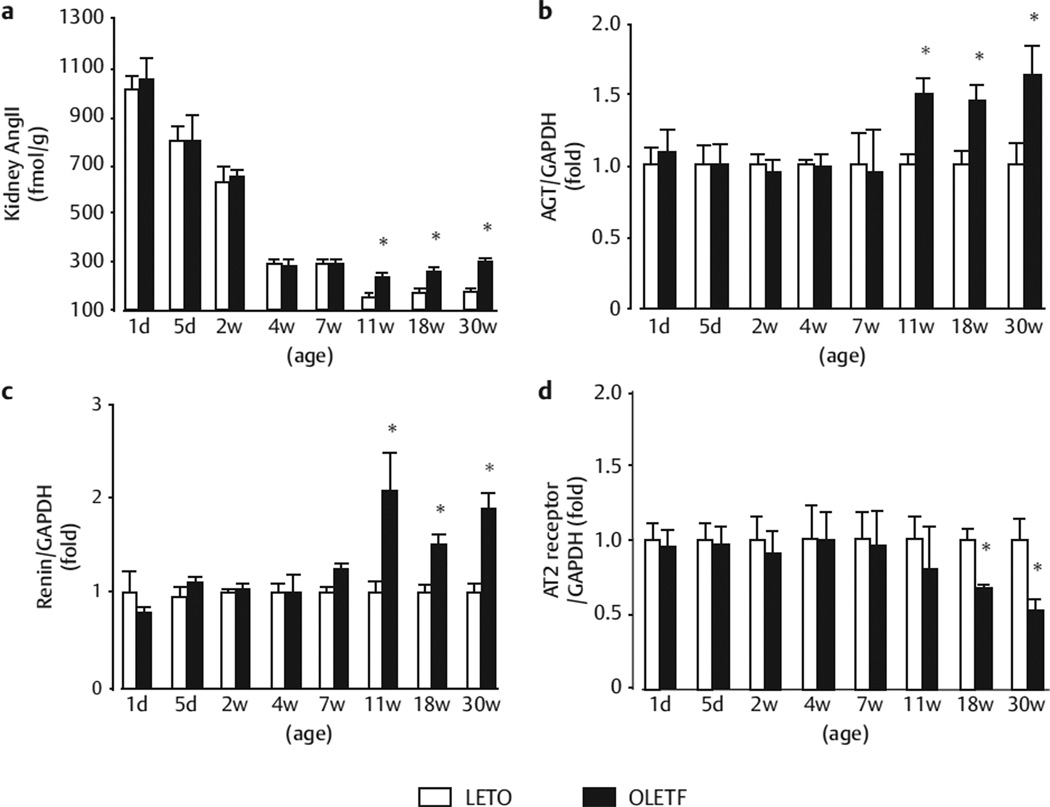
Fig. 2.
Time profiles of intrarenal cortical tissue Ang II content agene expression levels of AGT b renin c, and AT2 d. The mRNA expression levels are expressed as the relative differences between OLETF rats (number of 2 weeks: 22; 4 weeks: 10; 7 weeks: 10; 11 weeks: 10; 18 weeks: 8; 30 weeks: 6) and LETO rats (number of 2 weeks: 10; 4 weeks: 10; 7 weeks: 10; 11 weeks: 9; 18 weeks: 10; 30 weeks: 12) after normalization for the expression of GAPDH. *p < 0.05 vs. LETO rats at the same age.

