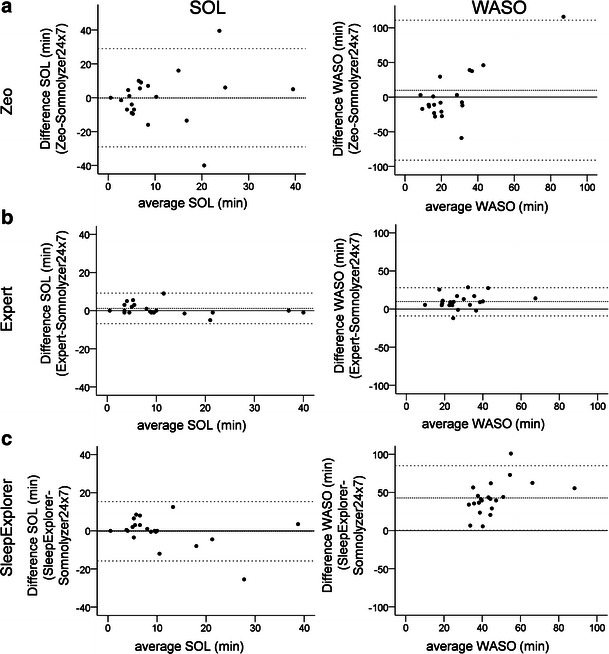
Fig. 1.

Bland–Altman plots of sleep parameters SOL and WASO showing differences between Somnolyzer 24 × 7 and a Zeo, b expert c SleepExplorer scorings. The x-axes indicate the average from both the study standard and comparison scoring of wake after sleep onset and sleep onset latency. The difference is expressed as the comparison score minus the study standard score. The mean difference and the limits of agreement (±1.96 SD) are represented as dashed lines. Note that high variabilities are dominant for Zeo scorings
