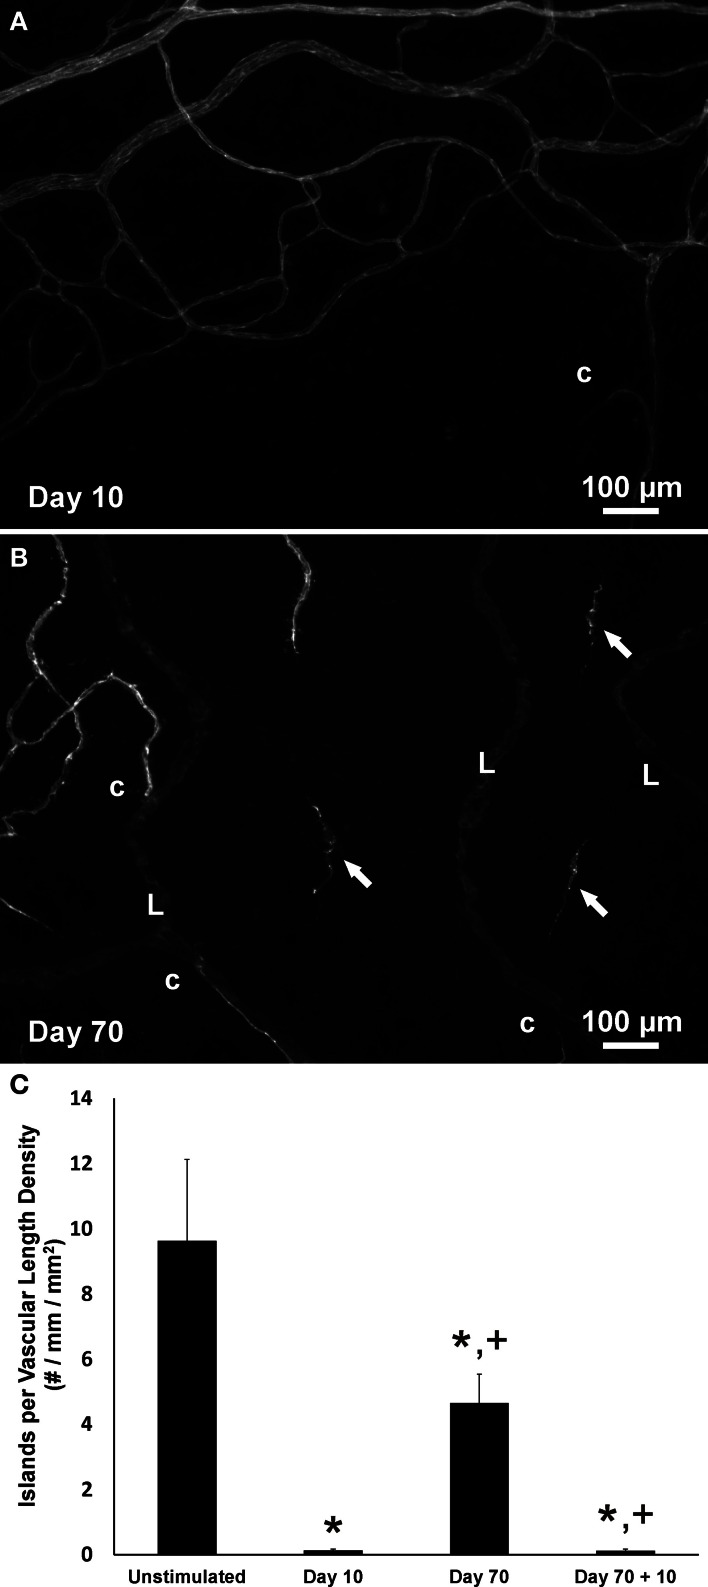
Figure 3.
The presence of vascular islands is associated with network regression. (A,B) Representative images of the periphery of vascular networks labeled for PECAM at day 10 (A) and at day 70 post stimulation (B). At day 70 during microvascular network regression, the number of vascular islands (arrows) is increased. Blind ended capillary segments still connected to a network are indicated by “c.” Lymphatic vessels are indicated by “L.” (C) Quantification of the number of vascular islands per vascular length density over the time course of growth, regression, and regrowth. *p < 0.05 compared to the unstimulated group, +p < 0.05 compared to the previous time point. Values are means ± SEM.

