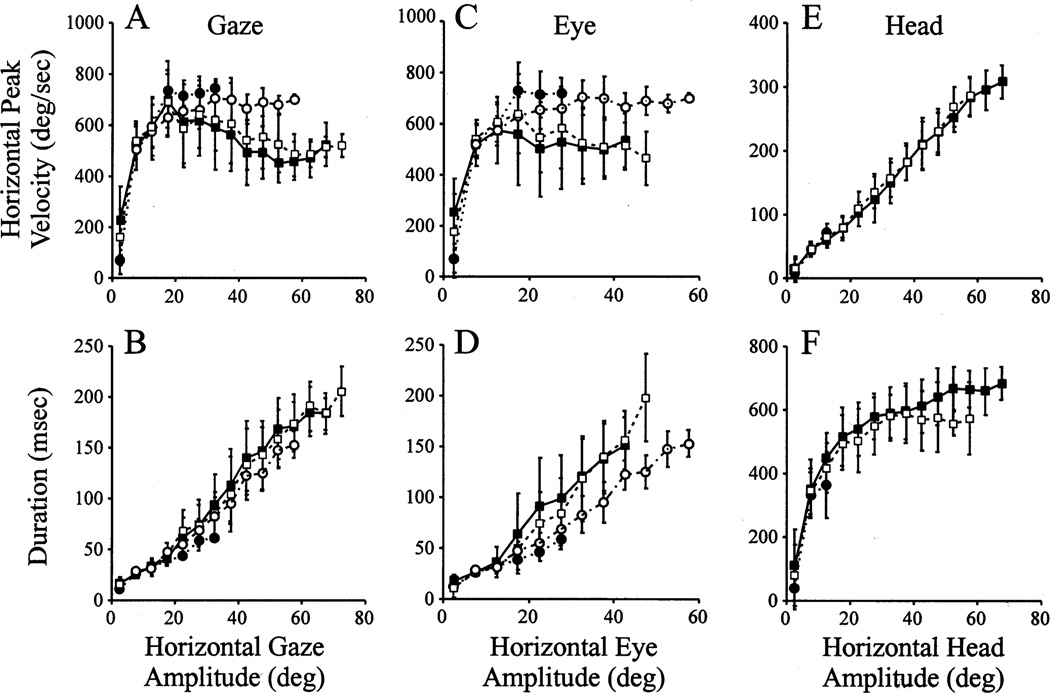
Fig. 6.
Average plots of the main sequence properties of gaze, eye and head movements during head-unrestrained gaze shifts of monkey CH. (A) Horizontal gaze peak velocity vs. horizontal gaze amplitude; (B) Horizontal gaze duration vs. horizontal gaze amplitude; (C) Horizontal eye peak velocity vs. horizontal eye amplitude; (D) Horizontal eye duration vs. horizontal eye amplitude; (E) Horizontal head peak velocity vs. horizontal head amplitude; (F) Horizontal head duration vs. horizontal head amplitude. The filled squares joined by solid lines refer to G2Y movements in the dissociation paradigm. The open squares linked by dash lines quantify Y2Y movements in the standard task. The filled circles connected by dots represent R2G movements in the dissociation task. The open circles associated with the dot-dash lines correspond to saccades collected in the head-restrained condition. In all cases, the error bars mark one standard deviation. Only those movements with IEPh = ± 10° (of center) were included in the analysis. Leftward and rightward gaze shifts were combined. The window size to average the data was 5°.

