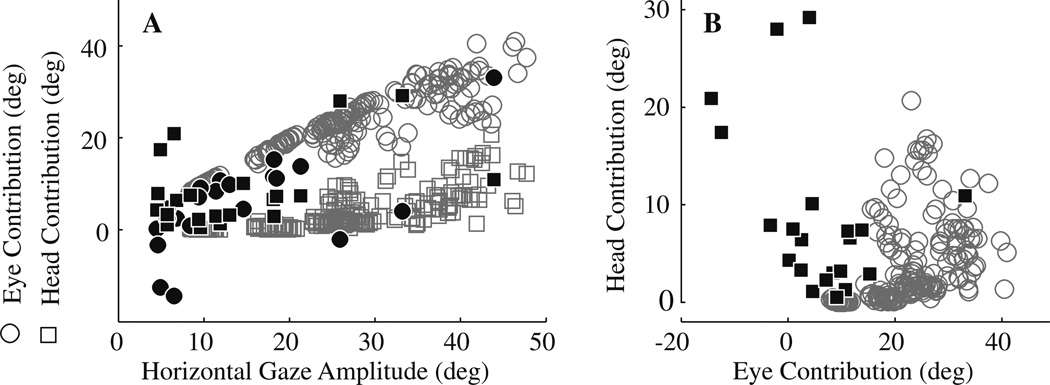
Fig. 3.
Distribution of eye and head contributions. a Eye (○) and head (□) contributions are plotted as a function of horizontal gaze amplitude evoked by stimulation of the PPRF region (filled symbols; n = 21 sites) and for visually-guided, horizontal gaze shifts (open, gray symbols; n = 200). Note that eye contributions can be negative for positive, stimulation-evoked changes in gaze (e.g., Fig. 1f, g). For the visually-guided gaze shifts, the initial eye positions were limited to ±5° and initial head positions were restricted to ±10°. For the stimulation-evoked movements, the initial eye positions were limited to ±12° and initial head positions were restricted to ±10°. b An alternate representation of panel a. Head contribution is plotted as function of eye contribution for visually-guided gaze shifts (○) and for eye-head movement evoked by stimulation of the PPRF (■). The distributions of two types of movements are clearly different

